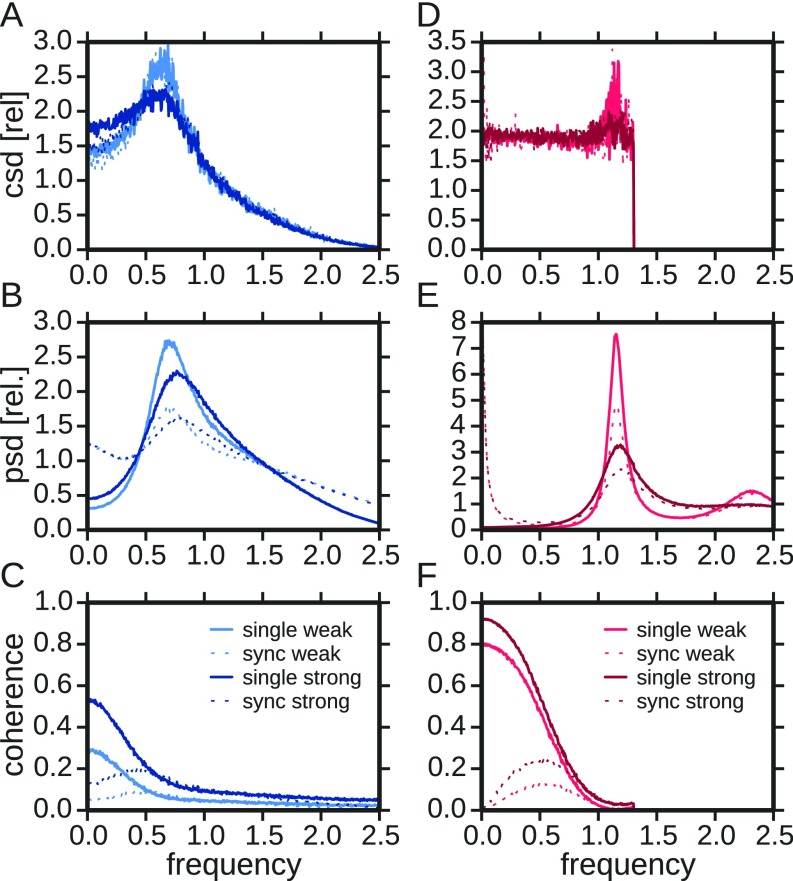
Fig. S4.
Spectral analysis of model neuron. (A–C) Cross-, power, and coherence spectra of LIF neuron (Eq. S1) with , , and . (D–F) Same analysis for , , and . In each panel the respective spectra of the single trials (solid lines) and the synchronous responses (dotted lines) are shown for two different stimulus intensities (“weak”) and (“strong”). Cross- and power spectra are normalized to their average. Remaining parameters: , and width of box-kernel was chosen, such that the product of baseline firing rate and equals 0.2. Parameters were selected to qualitatively resemble experimental results in Fig. 5 of the main text. csd, cross-spectral densities; psd, power-spectral densities; rel, relative.

