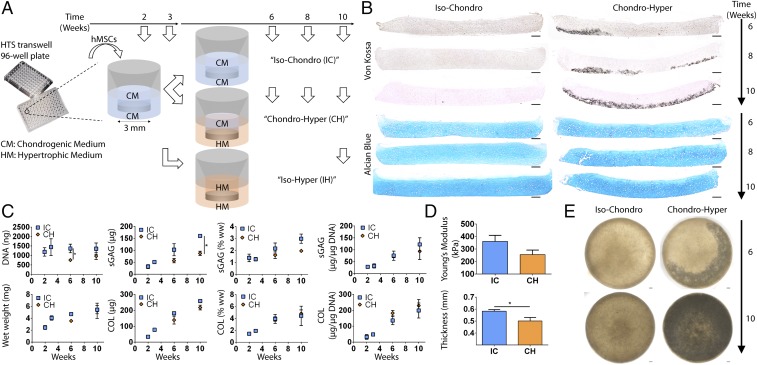
Fig. 1.
Experimental design and tissue morphogenesis. (A) Schematic of the induction regimens. (B) Progressive deep mineralization in the CH group but not the IC group (Von Kossa), and maintenance of hyaline cartilage in both groups (Alcian blue). (C) Biochemical analyses revealed a lower DNA content (6 wk) and a lower GAG content (10 wk) in the CH group. COL content and GAG and COL productivities (normalized to DNA) were similar. sGAG, sulfated GAG; ww, wet weight. (D) Mechanical testing showed similar compressive Young’s modulus between the groups. The IC group was slightly thicker. (E) Whole-tissue bright-field images showed near-complete mineralization by 10 wk. Mean ± SEM; *P < 0.05. (Scale bars, 200 µm.)

