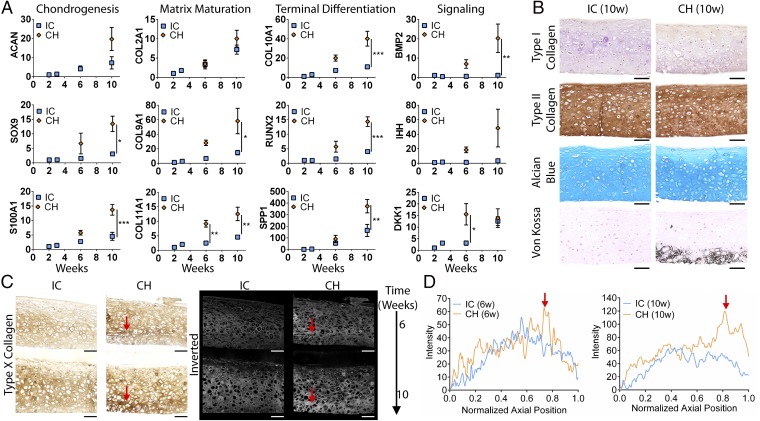
Fig. 2.
Cartilage maturation and organization. (A) The CH group showed increased expression of cartilage homeostasis (SOX9, S100A1), chondrocyte maturation (COL9A1, COL11A1), terminal differentiation (COL10A1, RUNX2, SPP), and trophic markers (DKK1, BMP2, IHH) (for primers please Table S1). ACAN and COL2A1 expression was similar between groups. All gene expression (2−∆∆Ct) is normalized to GAPDH and 2-wk controls. (B) Hyaline cartilage at 10 wk with homogeneous type II collagen and GAG deposition. The CH group was mineralized in the deep zone. (C) Type X collagen immunohistochemical stains and inverted images. Red arrows indicate bands of hypertrophy. (D) Intensity profile of stains showed distinct deep-zone peaks in the CH group. Mean ± SEM; *P < 0.05, **P < 0.01, and ***P < 0.001. (Scale bars, 200 µm.)

