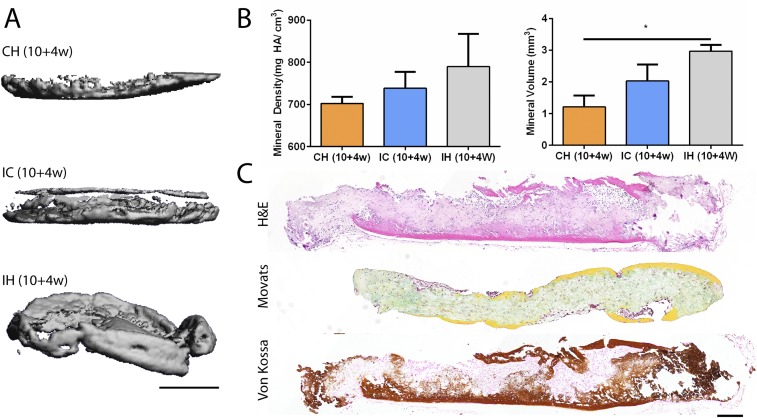
Fig. S4.
In vivo outcomes of the isotropic hypertrophic control group. (A) Representative µCT images of CH, IC, and IH discs following 10-wk induction and 4-wk implantation. (Scale bar, 1 mm.) (B) The IH group exhibited greater mineral density and volume following implantation. (C) Histological stains showing extensive endochondral ossification with bone formation and marrow infiltration from all sides of the tissue. Mean ± SEM; *P < 0.05. (Scale bar, 200 µm.)

