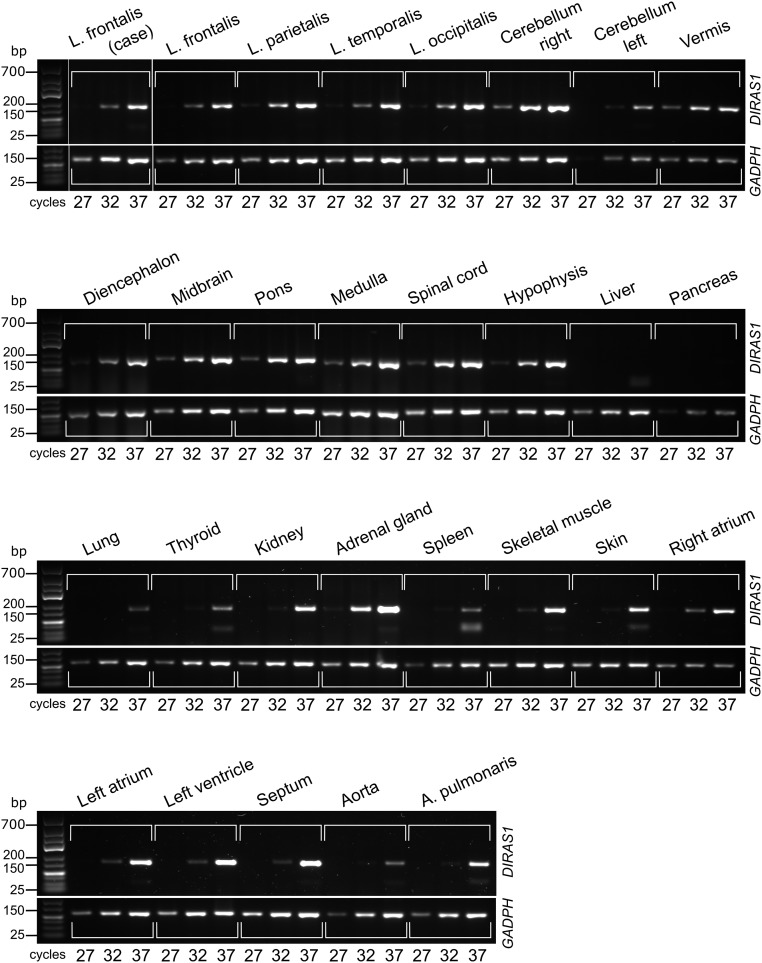
Fig. S4.
DIRAS1 expression pattern. Expression profiling of the DIRAS1 transcript across 28 tissues indicates abundant pattern in the different regions of the brain but more limited pattern is found in nonneural tissues. The stability of the DIRAS1 transcript is not markedly altered in the frontal lobes of a case (RR) and a control (Belgian Shepherd) dog by a semiquantitative PCR using GADPH as a loading control. A, arteria; L, lobus.

