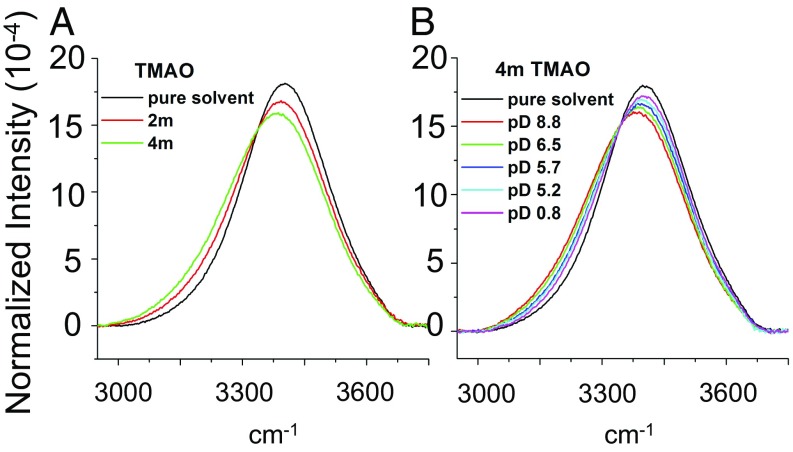
Fig. 5.
IR spectra of 3 mol% H2O in D2O with TMAO as (A) a function of osmolyte concentration and (B) a function of pD at 4 M TMAO. In all cases, the spectra have been normalized to have the same area under each curve. The spectrum for pure water is shown in each case as a reference. Spectra in the OH stretch range over a wider range of TMAO concentrations are provided in SI Materials and Methods (Fig. S9).

