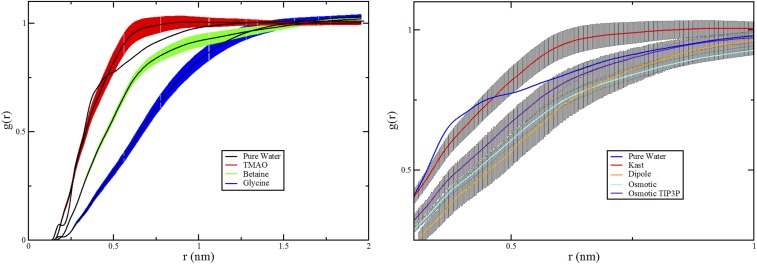
Fig. S1.
Statistical analysis of simulated atomic RDFs. All curves present results for the CHARMM peptide model. With the exception of the osmotic TIP3P curve, which corresponds to simulations with the TIP3P water model, all curves present results with the SPC/E water model. In Left, the central black lines correspond to the RDFs presented in Fig. 4A, whereas the colored bands indicate the statistical uncertainty. The statistical uncertainty for water is within the thickness of the line. Right compares the statistical uncertainty in the corresponding RDFs from simulations of the various TMAO models with three-site water models. In each case, the statistical uncertainty is obtained as the SE obtained from splitting the simulation trajectory into blocks of 10-ns duration.

