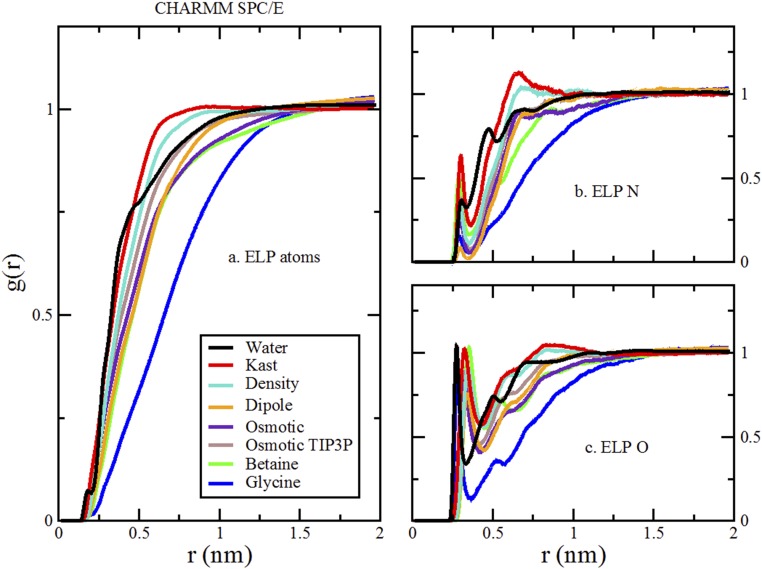
Fig. S5.
Comparison of RDFs from simulations of various cosolvents and TMAO models with the SPC/E water model and CHARMM peptide model. The brown curves are distinct and present results for the osmotic model with the TIP3P water model. As in Fig. 4, A presents the RDFs for all ELP atoms to all cosolvent or water atoms. B presents the RDFs for the nitrogen atoms of four ELP valine and glycine residues to the oxygen atoms of the cosolvents and water. C presents the RDFs for the carbonyl oxygen atoms of five ELP residues to the nitrogen atom of glycine, the methyl carbon atoms of betaine and TMAO, or the oxygen atom of water.

