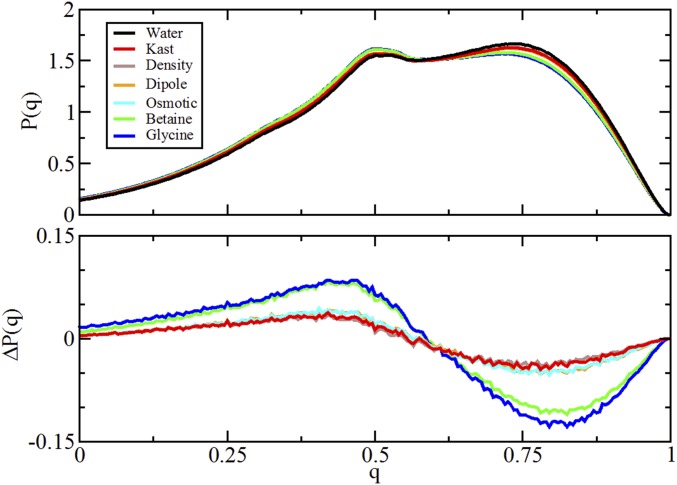
Fig. S11.
Comparison of simulated tetrahedral-order distribution from simulations of various TMAO models and cosolvents in SPC/E water. Upper presents the distribution P(q) sampled by bulk water molecules in each solution. Lower presents the difference between the distributions sampled by the bulk solution in the absence and presence of each cosolvent.

