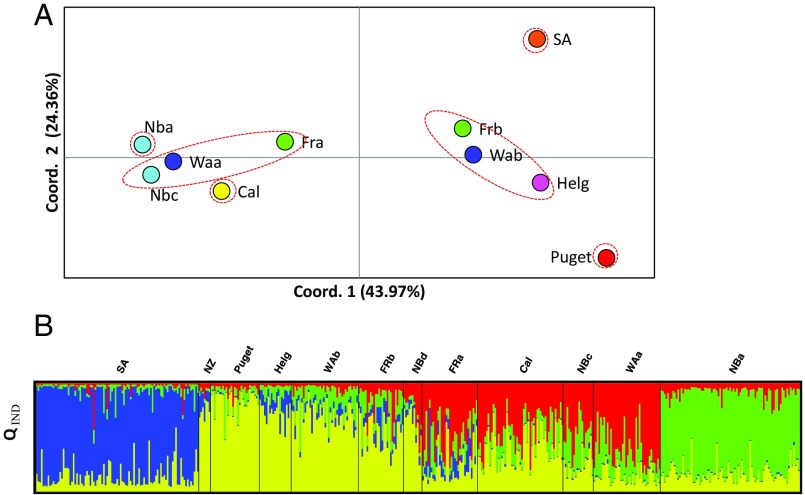
Fig. 3.
Genetic subdivision among global samples. (A) Principal coordinates analysis of genetic divergence (FST) among samples for which the number of isolates was larger than 15. Sample names refer to those denoted in Fig. 1B, and colors refer to site markers in Fig. 1A. Relative proximity among samples in the graph represents genetic proximity (FST). Coordinates 1 and 2 explain 43.96% and 24.36%, respectively, of variation among samples. Samples encircled in dashed red lines represent statistically significant populations identified using genotypic tests. (B) Structure diagram displaying membership probability of each individual into K = 4 populations (denoted by different colors). Each individual is depicted by a vertical line partitioned into K colored sections, with the length of each section proportional to the estimated membership coefficient (QIND) of the isolate to each cluster. Sample names refer to those denoted in Fig. 1B.

