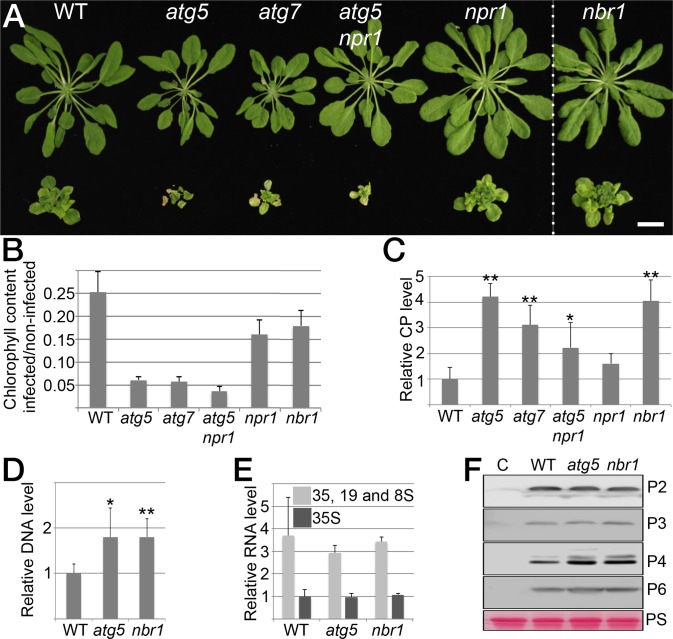
Fig. 1.
Autophagy promotes plant fitness and suppresses CaMV accumulation. (A) Virus-induced symptoms in WT, atg5, atg7, atg5 npr1, npr1, and nbr1 plants at 28 dai with CaMV strain CM1841 (Lower Row) compared with noninfected controls (Upper Row). (Scale bar, 20 mm.) (B) Ratio of total chlorophyll content in infected and noninfected plants. Error bars represent SD (n = 6). (C) CaMV capsid protein (CP; P4) levels determined by ELISA in systemic leaves of the indicated genotypes at 14 dai. Values are shown as means ± SD (n = 4) and are presented as arbitrary units relative to WT plants. (D) CaMV DNA levels determined by qPCR in systemic leaves of WT, atg5, and nbr1 plants at 14 dai. Values represent means ± SD (n = 4) relative to WT plants and were normalized with 18S ribosomal DNA as the internal reference. (E) CaMV RNA levels determined by RT-qPCR as an individual 35S transcript or via the leader sequence as the sum of 35S, 19S, and 8S transcripts in systemic leaves of WT, atg5, and nbr1 plants at 14 dai. Values are shown as means ± SD (n = 3 biological replicates) relative to the WT 35S transcript level. (F) Immunoblot analysis of CaMV P2, P3, P4, and P6 accumulation in WT, atg5, and nbr1 plants. Total proteins were extracted from whole plants at 14 dai and probed with specific antibodies. Noninfected WT plants served as control (C) for signal background, and Ponceau S (PS) staining verified comparable protein loading. Statistical significance (*P < 0.05; **P < 0.01) was revealed by Student´s t test (compared with WT).

