Fig. 2.
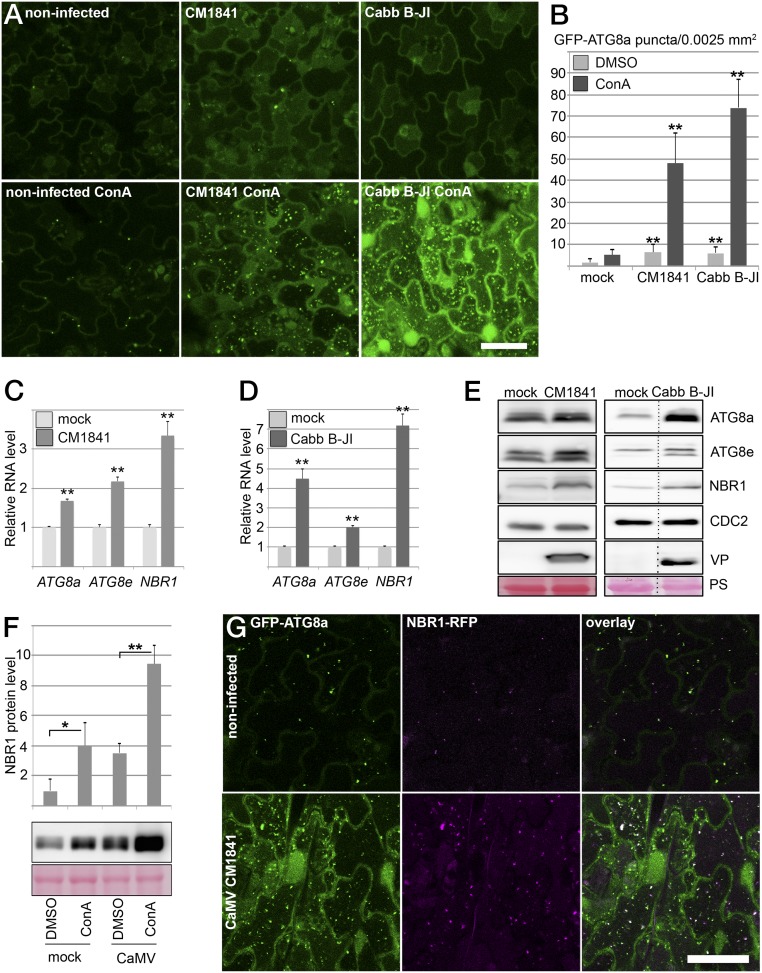
NBR1-mediated selective autophagy is induced upon CaMV infection. (A) Transgenic expression of GFP-ATG8a for detection of autophagosome structures in uninfected leaf tissue (control) and in leaf tissue infected with CaMV CM1841 or Cabb B-JI at 14 dai in the absence (Upper Row) or presence of ConA compared with the noninfected control. Images represent single confocal planes from abaxial epidermal cells and were taken with identical microscope settings. (B) Quantification of GFP-ATG8a puncta in mock-infected and infected tissue after DMSO or ConA treatment. The number of puncta was calculated from areas of 0.0025 mm2. Values represent means ± SD (n ≥ 16 independent areas). (C and D) qPCR analysis of ATG8a, ATG8e, and NBR1 transcript levels in WT plants infected with CaMV CM1841 (C) or Cabb B-JI (D) at 14 dai compared with noninfected plants (mock). Values represent the mean ± SD (n = 3 biological replicates) relative to the noninfected control. (E) Immunoblot analysis of the levels of ATG8a, ATG8e, and NBR1 proteins in CaMV-infected and control samples from C and D. The accumulation of the cell-cycle protein CDC2 and Ponceau S staining (PS) were used as loading control, and detection of viral proteins (VP; P6 for CM1841 and P4 for Cabb B-JI) verified successful infection. (F, Upper) Direct ELISA quantitation of NBR1 protein levels in mock-infected and infected tissue (Cabb B-JI; 21 dai) after DMSO and ConA treatment. Values represent means ± SD (n = 3 biological replicates). (Lower) Immunoblot detection of NBR1 in the identical samples; Ponceau S staining served as the loading control. (G) Colocalization of NBR1-RFP and GFP-ATG8a in CaMV CM1841-infected leaves after ConA treatment in comparison with the control. Imaging was done with identical settings, and single confocal planes are shown together with the overlay. (Scale bars in A and G, 20 μm.) Statistical significance (*P < 0.05; **P < 0.01) was revealed by Student´s t test (compared with mock treatment in B, C, and D and with DMSO control in F).

