Fig. S5.
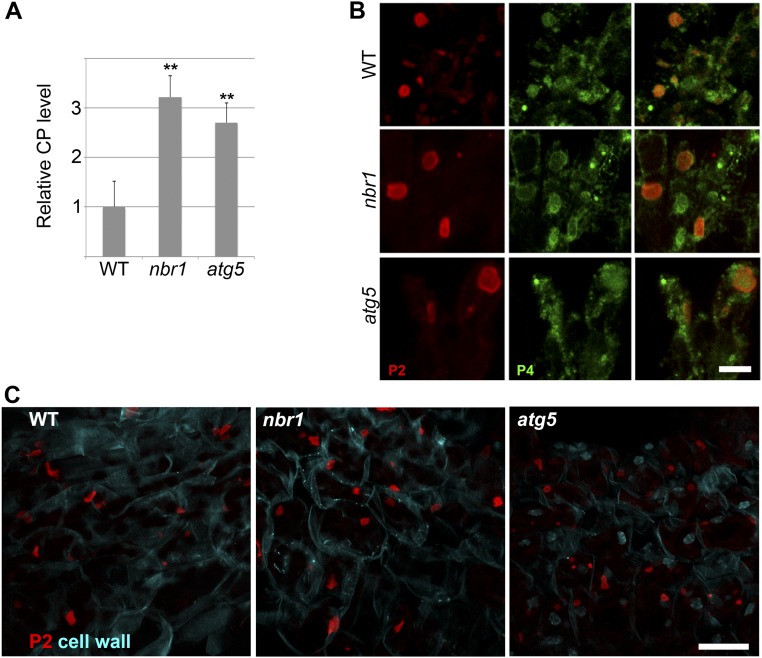
Autophagy does not impact transmission body function. (A) Viral titers of a P2-deleted CaMV Cabb B-JI mutant strain (Cabb B-JI ΔP2) in WT, nbr1, and atg5 plants. Capsid protein levels were determined by ELISA; values represent means ± SD (n = 4) relative to WT. Asterisks indicate statistical significance (**P < 0.01) determined by Student’s t test (compared with WT). (B) Immunofluorescence analysis of P2 together with P4 in CaMV Cabb B-JI–infected leaf tissue of WT, nbr1, and atg5 plants. Representative maximum projections of z-stacks show P4 in green and P2 in red. (Scale bar, 5 μm.) (C) Immunofluorescence analysis of P2 in CaMV Cabb B-JI–infected leaf tissue of WT, nbr1, and atg5 plants. Representative maximum projections of z-stacks show the cell wall in cyan and P2 in red. (Scale bar, 20 μm.)

