Fig. 3.
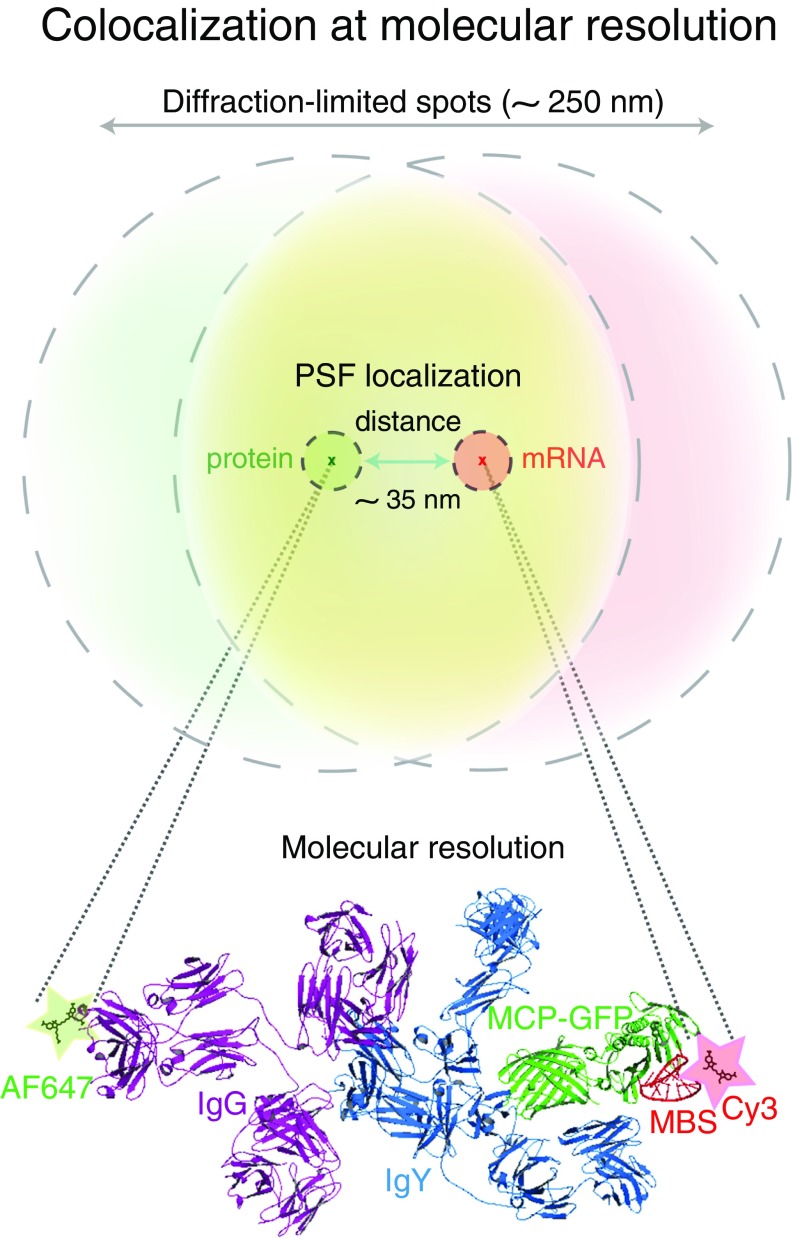
Association between β-actin mRNA (MBS) and MCP as a molecular model mRNP. Schematic representation of overlapping red (RNA) and green (protein) diffraction-limited spots in a wide-field image and the molecular scale with nanometer precision of MCP-GFP and β-actin (MBS) interaction. By measuring and fitting a Gaussian curve to the PSF, the position in x, y, and z of its center can be determined accurately with high spatial resolution (compare outer dotted line with inner dotted line). One Cy3-labeled MBS (red), MCP-GFP (green), primary antibody (IgY; light blue), and Alexa Fluor 647-labeled secondary antibody (IgG; purple) are depicted. The mean observed distance between labeled antibody and labeled RNA FISH probes is 34.58 nm (Fig. 2H). The distance for MCP-GFP to β-actin mRNA is estimated at 7 nm. The drawing of the molecules was generated in PyMol software with the help of published structure data (22, 44).

