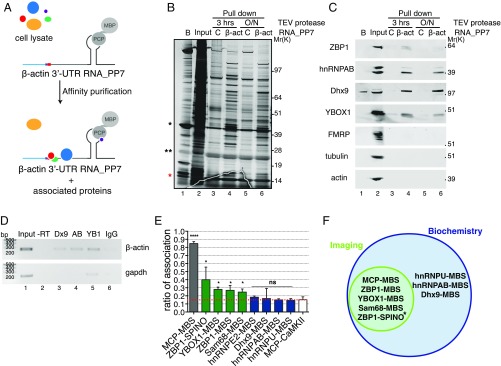
Fig. 5.
Validation of β-actin 3′-UTR affinity purification of associated proteins. (A) Schematic representation of β-actin 3′-UTR pulldown strategy. In vitro-transcribed PP7-tagged zipcode-containing β-actin 3′-UTR RNA was incubated with mouse embryonic fibroblast cell lysates, affinity-purified on amylose magnetic resin, and incubated with TEV protease either for 3 h or overnight (O/N) to identify protein components that interact with β-actin mRNA and ZBP1 protein. β-Actin 3′-UTR containing one PP7 binding site (gray) bound by PP7 coat protein (PCP) fused to MBP (gray circles), the zipcode element (red), and the coding region (light blue) are depicted. (B) Silver-stained SDS/PAGE gel of proteins specifically bound to β-actin 3′-UTR RNA isolated from mouse embryonic fibroblast extracts using either a control (C; lanes 3 and 5) or β-actin 3′-UTR (lanes 4 and 6) as a bait. A list of proteins identified by LC-MS/MS is summarized in Fig. S5B and Dataset S1. Molecular weight (Mr) is shown. Beads (B; lane 1) indicate proteins remained bound to beads after TEV elution. Input (lane 2) indicates 3 μg total protein. Lanes 3–6 show 60% of pulldown eluates. Red asterisk indicates PCP. *MBP-PCP; **TEV protease. (C) Western blot analyses of indicated proteins in input and pulldown eluates on TEV protease digestion for 3 h or overnight (O/N) as indicated. Molecular weight (Mr) is shown. Beads (B; lane 1) indicate proteins that remained bound to beads after TEV elution. Input (lane 2) indicates 30 μg total protein. Lanes 3–6 show 40% of pulldown eluates. The results shown are representative of three independent experiments. (D) RIP. Enrichment of (Upper) endogenous β-actin and (Lower) GAPDH mRNAs in Dhx9 (Dx9), hnRNPAB (AB), and YBOX1 (YB1) immunoprecipitations (lanes 3–5) compared with IgG control (lane 6). A PCR carried out without reverse transcriptase (−RT) is shown in lane 2. (E) Summary of association of the indicated mRNA and proteins by smFISH-IF in dendrites. Dotted red line indicates background association defined by MCP-CaMKII. Error bar, SD. Unpaired t test; ns indicates P > 0.05. *P < 0.05; ****P < 0.0001. (F) Venn diagram showing mRNA and protein association validated by both imaging and biochemistry approaches in this work. *mRNA–protein association validated by biochemistry in ref. 16.

