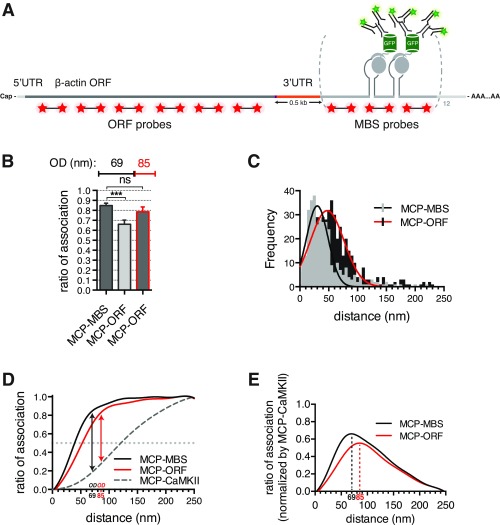
Fig. S3.
Super registration as a molecular ruler. (A) Schematic representation of MBS-containing β-actin mRNA. Labeled RNA FISH MBS and ORF probes (red stars), MCP-GFP (gray circles and green barrels), and antibodies (green) are depicted. Two MBSs separated by linker regions (gray) are illustrated for simplicity. Distance between the stop codon and MBS is ∼500 nt (3′-UTR; shown in orange). (B) Ratio of association for MCP-GFP and β-actin mRNA in neurons comparing MBS or ORF probe sets (MCP-MBS and MCP-ORF, respectively) shows that optimal distance with the ORF probes is 85 nm. Optimal distance is in nanometers. Error bar, SD. Unpaired t test; ns indicates P > 0.05. OD, optimal distance. ***P < 0.001. (C) Distribution of observed distances for MCP-MBS (light-gray bars and black line) and MCP-ORF (black bars and red line) shows the shift consistent with the increased distance from the MCP to the ORF. (D) Curves of association for MCP-MBS (black line), MCP-ORF (red line), and MCP-CaMKII (dotted gray line) show that the curves converge at 85 nm. (E) Normalization of the curves of association for MCP-GFP and β-actin mRNA [using MBS FISH probes; black line (MCP-MBS)] and MCP-GFP and β-actin mRNA [D; using ORF FISH probes; red line (MCP-ORF)] reveals where the mRNA–protein association is maximally separated, defining the optimal distance. Optimal distance is 69 nm using MBS FISH probes (dotted black line; MCP-MBS) and 85 nm using ORF FISH probes (dotted red line; MCP-ORF).

