Fig. 2.
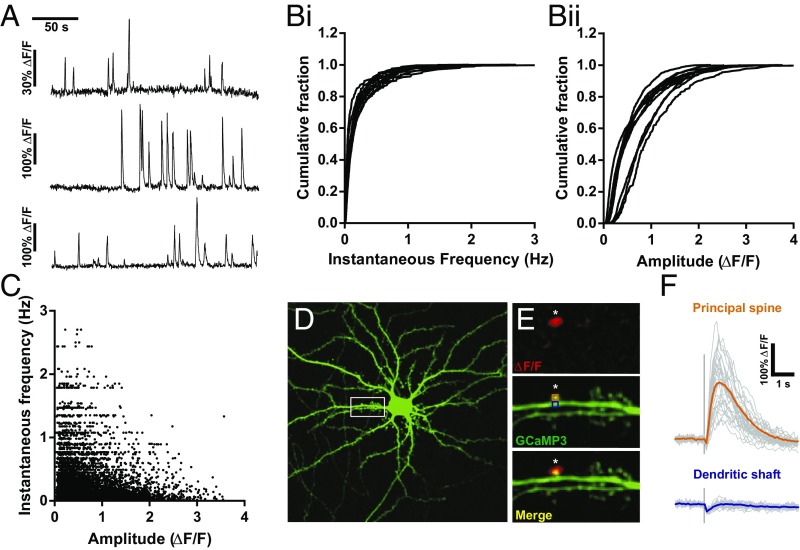
mCaTs are highly heterogeneous across the dendritic tree and within single spines. (A) ΔF/F traces from three different spines during the same recording. (B) Cumulative frequencies describing the distributions of instantaneous frequency (i) and amplitude (ii) of mCaTs for individual cells. (C) The amplitudes of individual mCaTs as a function of the instantaneous frequency of that event; n = 11 cells. (D) Hippocampal neuron expressing GCaMP3. White box corresponds to the area shown in the zoomed regions to the Right. (Scale bar, 10 μm.) (E) Repetitive uncaging of glutamate was performed at a single spine with UV laser (405-nm, 0.05-ms pulse) at a single point (indicated by the white asterisk). Top shows a ΔF/F summary image of an uncaging-induced calcium transient. Middle shows GCaMP3 expression within this dendritic segment, with the positions of the ROIs used. Bottom is a merge of the above panels. (F) Faint gray traces show responses at the principal spine and dendritic shaft for each uncaging trial delivered every 15 s at the principal spine and dendritic shaft as labeled (n = 33 trials). Mean responses for the principal spine and dendritic shaft are shown by bold orange and blue traces, respectively.

