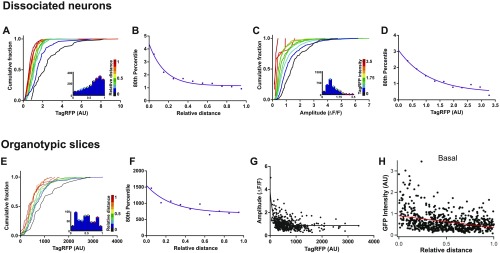
Fig. S9.
Spine volume decreases approaching branch tips. (A) Cumulative frequency distributions for TagRFP intensity for each spine recorded in in dissociated hippocampal cultures where each plot is color matched to a different bin for relative distance as shown in the key to the Right. Inset histograms show the number of spines included within each relative distance bin, n = 1,938 spines from 4 cells. (B) The 80th percentile values for TagRFP intensity obtained from the cumulative frequency graphs, plotted as a function of relative distance. Spearman’s coefficient; P < 0.0001. (C) Cumulative frequency distributions for mCaT amplitude, where each plot is color matched to a different bin for TagRFP spine intensity as shown in the key to the Right. Inset histograms show the number of spines included within each relative distance bin; n = 3,114 mCaTs from 4 cells. (D) The 80th percentile values for TagRFP intensity obtained from the cumulative frequency graphs, plotted as a function of relative distance. Spearman’s coefficient; P = 0.0008. (E) Cumulative frequency distributions for TagRFP intensity for each spine recorded in in organotypic hippocampal slice, where each plot is color matched to a different bin for relative distance as shown in the key to the Right. Inset histograms show the number of spines included within each relative distance bin, n = 603 spines from three cells. (F) The 80th percentile values for TagRFP intensity obtained from the cumulative frequency graphs, plotted as a function of relative distance. Spearman’s coefficient; P = 0.002. (G) Amplitude as a function of spine TagRFP intensity for spines obtained from organotypic slices. Spearman’s coefficient, P < 0.0001. (H) Plot of cytoplasmic EGFP intensity as a function of distance to branch point for basal dendritic branches in CA1 neurons from organotypic slices. Spearman’s correlation, r = −0.3; P < 0.0001; n = 679 spines.

