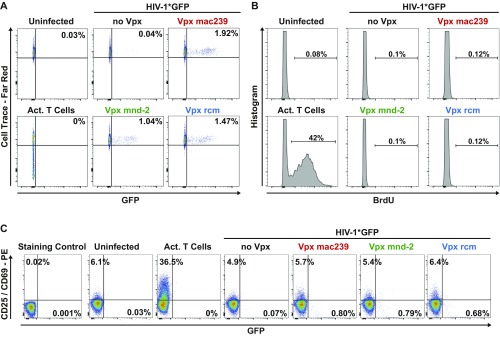
Fig. S3.
(A–C) Resting CD4 T cells were loaded with Cell Trace Dye (A) or BrdU (B) 1 d before infection and analyzed 3 d postinfection for Cell Trace-FarRed and BrdU expression levels, respectively. Alternatively, cells were stained for CD25/CD69 at the day of analysis (C). Depicted is one representative donor out of eight. Activated T cells served as positive control.

