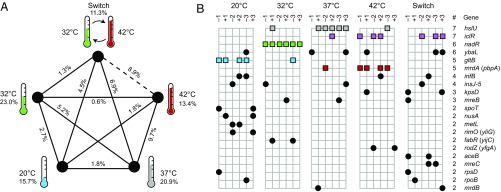
Fig. 2.
Mutations in several signature genes are associated with evolution under different temperature regimes. (A) Temperature treatments and edges connecting them are labeled with Dice similarity scores that represent the average percentage of mutated genes in common among all genome pairs within each treatment (Sw) and the average across all genome pairs between two treatments (Sb), respectively. Only the 132 qualifying mutations that affect a single gene were included in these calculations. The difference between Sb and Sw, indicating a temperature-specific pattern of genomic evolution, is significant (P < 0.05, randomization test with sequential Bonferroni correction) for all treatment pairs except the combination of the Switch (alternating 32 °C and 42 °C) and 42 °C regimes (dashed line). (B) Genes (rows) affected by at least two qualifying mutations in the 30 TEE clones (columns, organized by temperature regime and populations –1, +1, –2, +2, –3, or +3). The five signature mutations, shown as colored squares, are significantly associated with one or two treatments (see Gene Targets That Contribute to Evolved Thermal Specificity). All other mutations are depicted as black circles.

