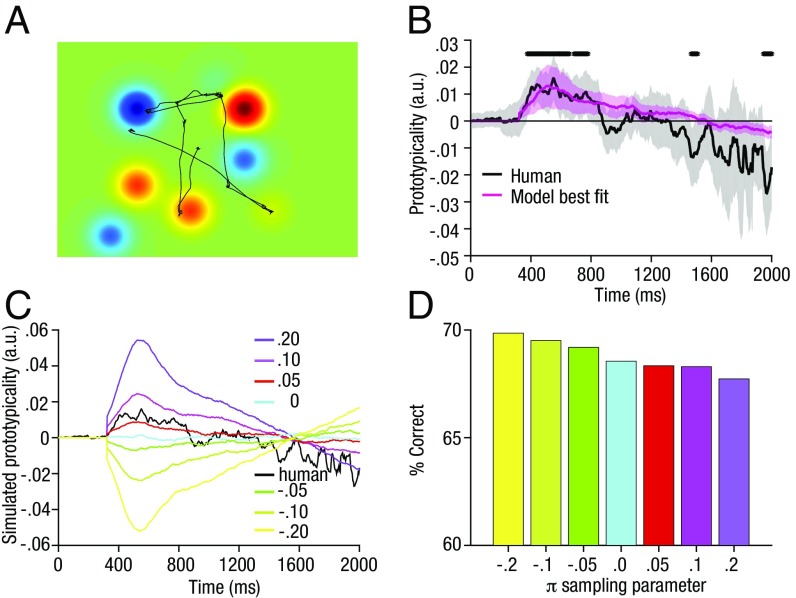
Fig. 2.
PTs for the human and model data. (A) Prototypicality landscape for the example trial from Fig. 1. This landscape is created by setting the height of the Gaussian (gk) associated with each number location equal to the prototypicality value Pk = 4.5 – tiedrank(|Vk – R|). (B) PT over time. Inlying items were viewed by preference from ∼400–800 ms poststimulus presentation, indicated by a significantly positive PT value (black). Significant clusters (P < 0.05, corrected for multiple comparisons) are marked by black bars (Methods). Shading around the lines signify 95% confidence intervals. The magenta line shows the predicted values for PT over time for the best fitting sampling strategy (determined per subject) of the model. (C) Simulated PTs for different sampling strategies (π) in the model. More positive values indicate a preference to sample inlying items first; more negative values indicate a preference to sample outlying items first. (D) Accuracy of the model under different sampling policies. Performance is lower for a sampling policy preferentially sampling inliers first (positive π) compared with sampling outliers first (negative π).

