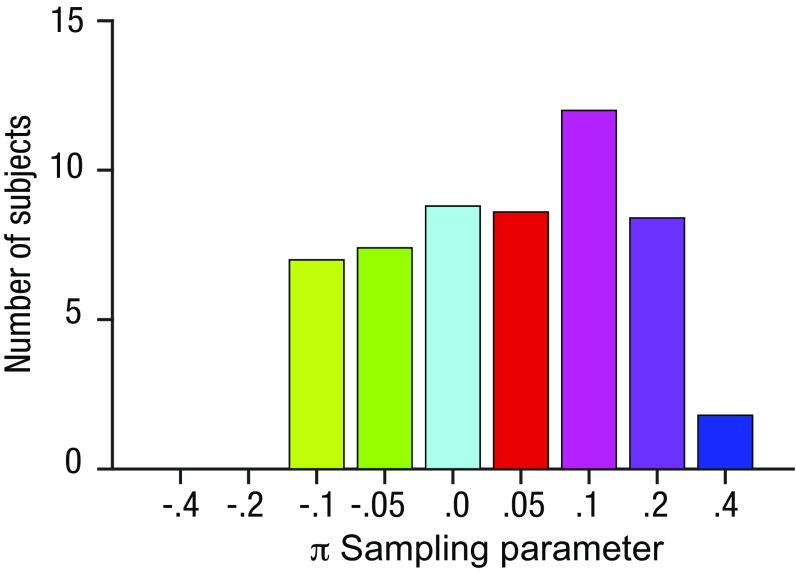
Fig. S4.
Histogram of the best fitting parameter values π from the model, over the human cohort. Because of random noise in the model, results varied slightly each time the model was fit, and so the results shown were obtained by fitting the model 10 times and averaging the number of subjects. Note that the x axis is an ordinal, not interval scale. The best fitting sampling parameter was significantly more positive than 0 (P < 0.05; on average, ∼57% of participants had a positive best fitting π—i.e., values of either 0.05, 0.1, 0.2, or 0.4—whereas 27% had a negative best-fitting π—i.e., values of either –0.05 or –0.1), indicating a tendency to preferentially sample inlying items.

