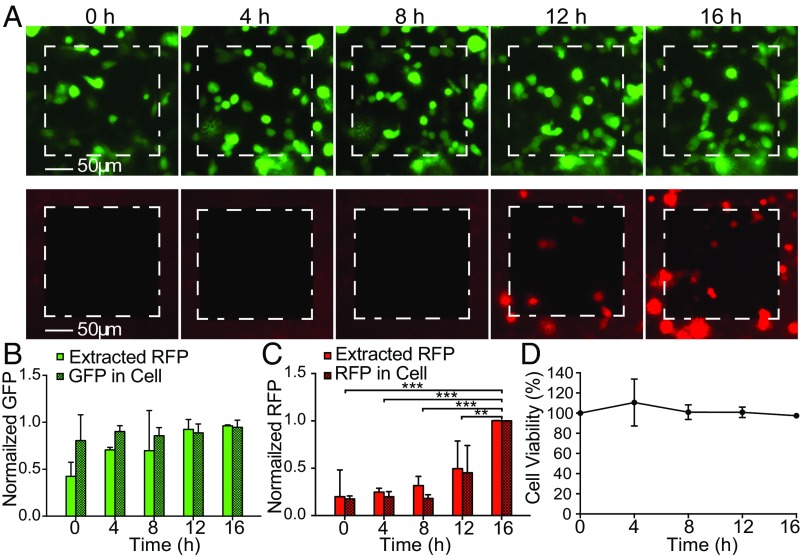
Fig. 2.
Longitudinal sampling of GFP/RFP from the same subpopulation of CHO cells. (A) Fluorescent microscopy images of GFP (green channel) and RFP (red channel) of a culture of 38 cells on a 200 × 200 µm NS sampling region (white dashed squares). Images were taken every 4 h just before the NEX sampling process was performed. RFP transfection was performed after the 8-h time point. (B) Normalized cellular GFP contents from fluorescence microscopy compared with the NEX-extracted GFP quantities. No statistically significant difference was observed between the relative extracted GFP level and relative intracellular GFP expression level from cells at each time point. Error bars indicate the SD of the underlying signal (n = 2, P > 0.05 for both factors; two-way ANOVA). (C) Normalized RFP fluorescence intensity compared with the extracted quantities. A small background signal was present before RFP transfection, but the clear increase in extracted RFP correlated with the actual increase in RFP expression. Error bars denote SD (n = 2, P < 0.05 between time points; P > 0.05 for extracted to fluorescence; **P < 0.01; ***P < 0.001; post hoc Tukey test). (D) Cell viability as a function of time (sampling points). Cultures showed >95% viability immediately after sampling and >100% over time as the cells divided.

