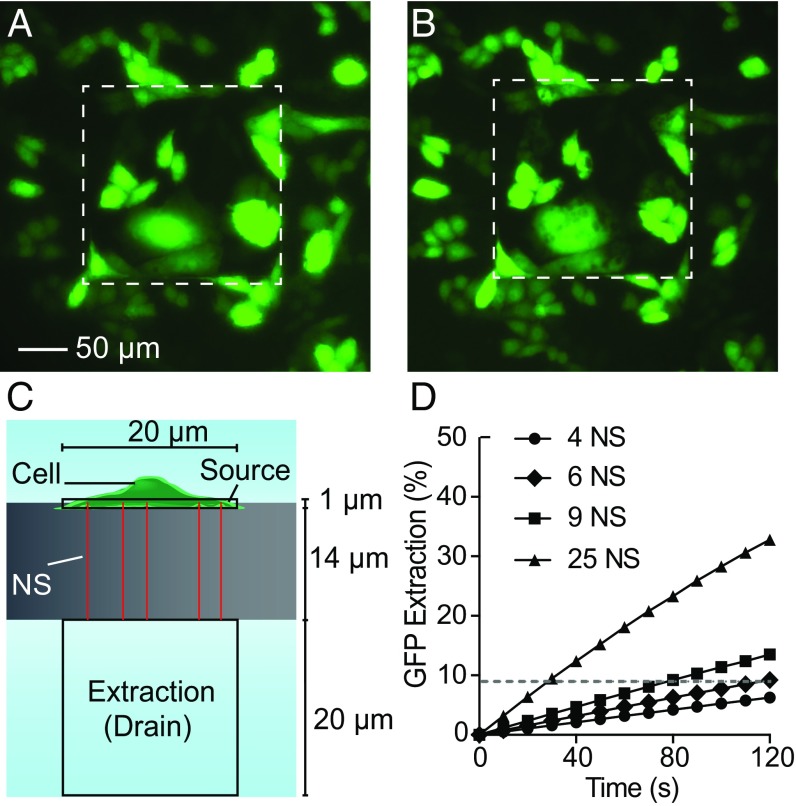
Fig. 4.
Sampling spatial distribution. (A and B) Fluorescent microscopy images of GFP of a culture of 26 cells on a 200 × 200 µm NS sampling region (white dashed squares). (Scale bar, 50 µm in A and B.) (A) GFP-expressing CHO cells before sampling. (B) GFP-expressing CHO cells immediately after sampling. Locally diminished GFP intensities (dark spots) were observed in the cells after sampling, corresponding to the locations where GFP was removed from the cells. Brightness was increased to highlight the spots. (C) Diagram of the finite element model of sampling through the NS. The cell was treated as a 20 × 20 × 1 µm source connected to the extraction buffer by varying numbers of NS 14 µm long and 150 nm in diameter. (D) The percentage of the cell’s initial GFP that diffuses into the extraction buffer as a function of time and the number of NS (the dashed line indicates the GFP extraction level after 2 min of diffusion from six NS).

