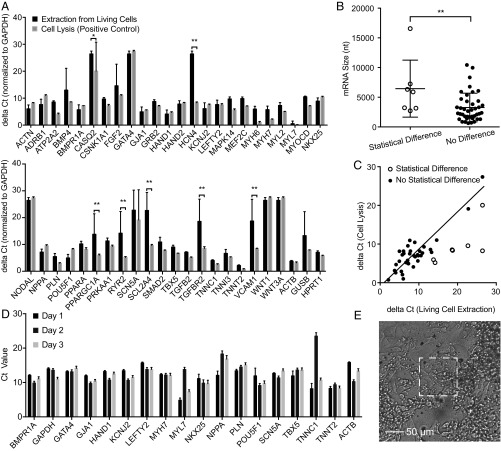
Fig. 6.
mRNA expression level in extractions from hiPSC-CMs. (A) mRNA expression level in NS-extractions from living cells (black bars) and from lysed cells (gray bars) in ΔCt (normalized to GAPDH) (42). A higher ΔCt represents lower mRNA expression; the baseline ΔCt was set to 40 cycles to indicate no expression. Of the 48 genes, seven genes are found to be statistically different from the lysis control (n = 4 for living cell extraction; n = 2 for cell lysis; *P < 0.05; **P < 0.01; t test with 95% CI, pooled SD. (B) mRNA sizes of matched and unmatched genes; *P < 0.05, t test, shows a slight difference in the detection of larger and smaller genes. (C) Correlation of ΔCt of the 40 matched genes in living cell extractions with the mRNA expression level in cell lysis (R2 = 0.89, P < 0.0001). Unmatched genes are indicated as unfilled circles. (D) Longitudinal mRNA expression level of approximately 15 hiPSC-CMs on the 100 × 100 µm NS platform over 3 d. Fifteen of eighteen genes showed consistent gene expression, demonstrating the reliability of the sampling process. Error bars indicate the SD of technical duplicates. (E) Microscopy image of approximately 15 hiPSC-CMs after day 3 sampling. These cells were actively beating (Movie S1) but could still be sampled successfully.

