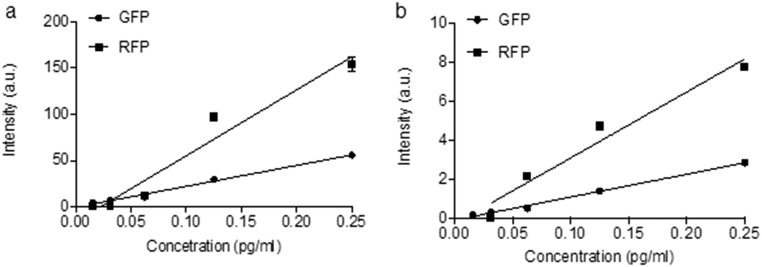
Fig. S4.
GFP/RFP concentration and intensity calibration curves. GFP and RFP solutions with concentrations of 0.25, 0.13, 0.07, 0.04, and 0.02 pg/mL were injected into a glass microfluidic chamber 10 µm wide and 12 µm deep (PerkinElmer). Microscopic fluorescence images of the GFP/RFP-filled microfluidic chamber were obtained using exposure times of 200 ms (A) and 25 ms (B). The fluorescence intensity of the GFP/RFP solutions was measured by Image J (n = 3; error bars show SD).

