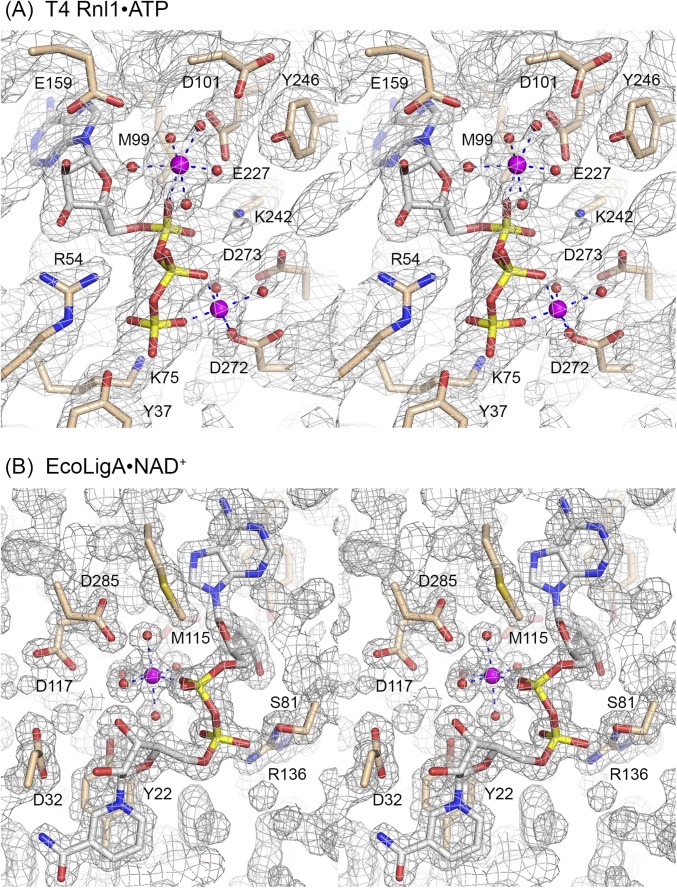
Fig. S1.
Stereoviews of active site electron density. The 2Fo–Fc maps of the T4 Rnl1•ATP (A, contoured at 1σ) and EcoLigA•NAD+ (B, contoured at 1.5σ) complexes are shown in gray mesh. The ATP and NAD+ nucleotides, metal ions, and waters were omitted during refinement and phase calculation. Ligase amino acids are depicted as stick models with beige carbons. ATP and NAD+ are depicted as stick models with gray carbons. Metal ions and coordinated waters are rendered as magenta spheres and red spheres, respectively. The atomic contacts of the octahedrally coordinated magnesium ions are indicated by dashed lines.

