Fig. 3.
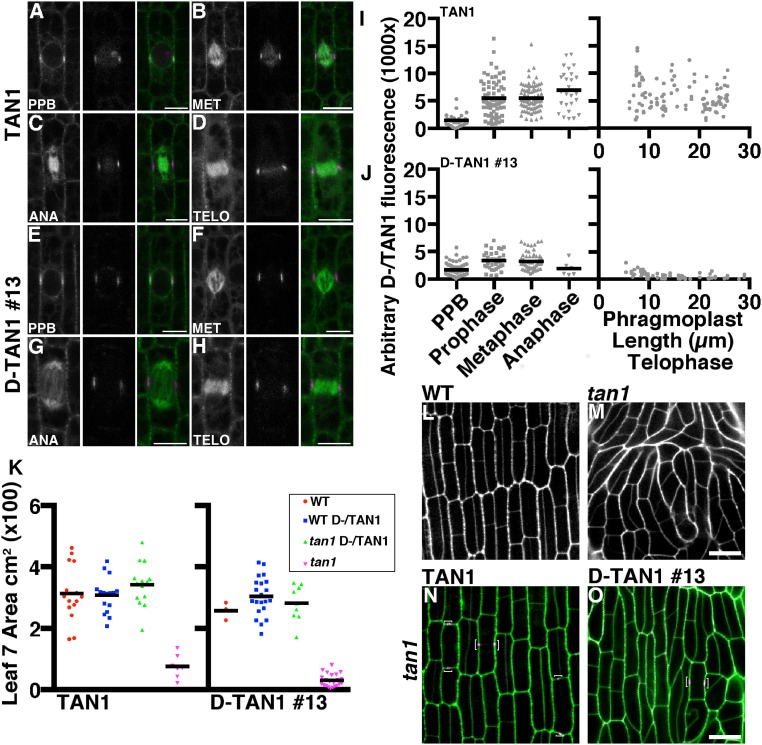
Localization and rescue of TAN1–YFP and D-TAN1-13–YFP during mitosis and cytokinesis. TAN1–YFP (magenta) localization during prophase (A), metaphase (B), anaphase (C), and telophase (D) indicated by CFP–TUBULIN (green). Channels are separated CFP–TUBULIN followed by TAN1–YFP and then merged. D-TAN1-13–YFP (magenta) localization during prophase (E), metaphase (F), anaphase (G), and telophase (H) indicated by CFP–TUBULIN (green). Channels are separated CFP–TUBULIN followed by TAN1–YFP and then merged. Arbitrary fluorescence intensities measured at the division site for TAN1–YFP (I) and D-TAN1 (J) using identical imaging conditions. (K) Leaf 7 area measurements of wild-type and tan1 segregating with TAN1–YFP and D-TAN1-13–YFP. Leaf areas between wild-type and tan1 TAN1–YFP are not statistically different (KS test, P = 0.1994) and are not different between wild-type and tan1 D-TAN1-13–YFP (KS test, P = 0.7091). (L) Wild-type and (M) tan1 epidermal cells stained with propidium iodide (green). (N) TAN1–YFP (magenta) expressed in tan1 mutant background stained with propidium iodide (green). (O) D-TAN1-13–YFP (magenta) in the tan1 mutant background stained with propidium iodide (green). (Scale bars, 10 μm.)

