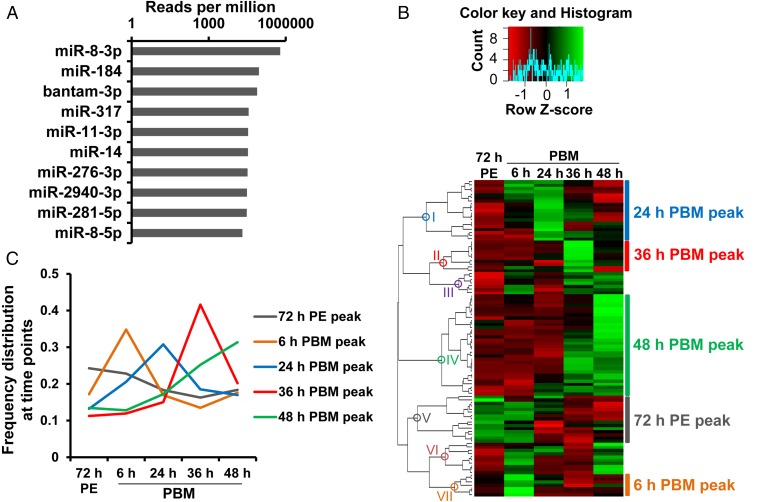
Fig. 1.
A time course of miRNA expression in the Ae. aegypti fat body following a blood meal. (A) Top 10 abundant miRNAs over the time course (note the log10-based horizontal axis). (B) Hierarchical clustering (Pearson correlation and complete linkage) of top 100 mature miRNAs over the time course; expression levels are represented by averages of normalized expression from three biological replicates. (C) Expression trend lines of five expression patterns peaking at 72 h PE (clade V), 6 h (clade VII), 24 h (clade I), 36 h (clade II), and 48 h PBM (clade IV). For each miRNA, expression profiles were converted to represent percentages of normalized reads at each time point. Averages were taken at each time point within clusters to display trend lines. Cluster colors are consistent with those in B.

