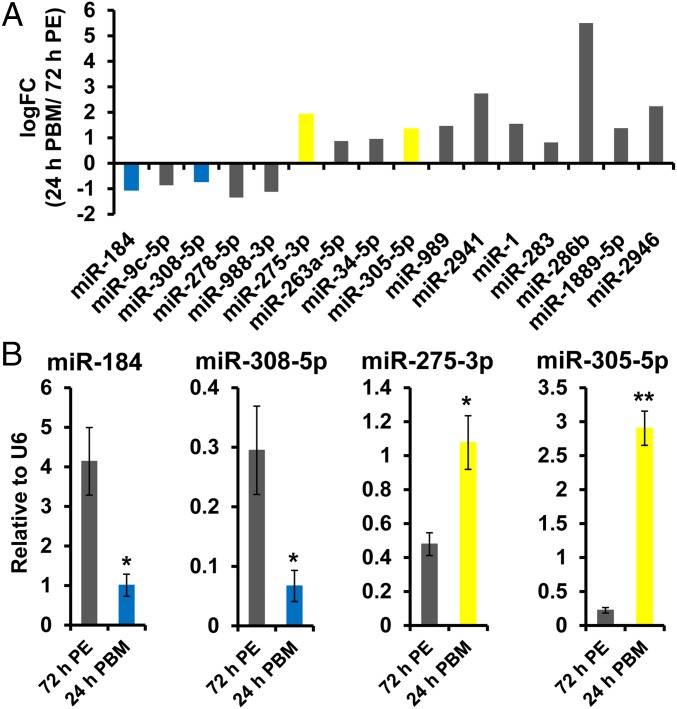
Fig. 2.
Differential expression of miRNAs at 72 h PE and 24 h PBM. (A) Differentially expressed miRNAs at 72 h PE and 24 h PBM (edgeR package). qPCR validation is highlighted by blue for down-regulation and yellow for up-regulation. (B) qPCR validation for four miRNAs, normalized to U6 snRNA. Three independent biological replicates were performed and statistical significance was calculated using unpaired t tests. Expression levels are represented as mean ± SEM (*P value < 0.05; **P value < 0.01).

