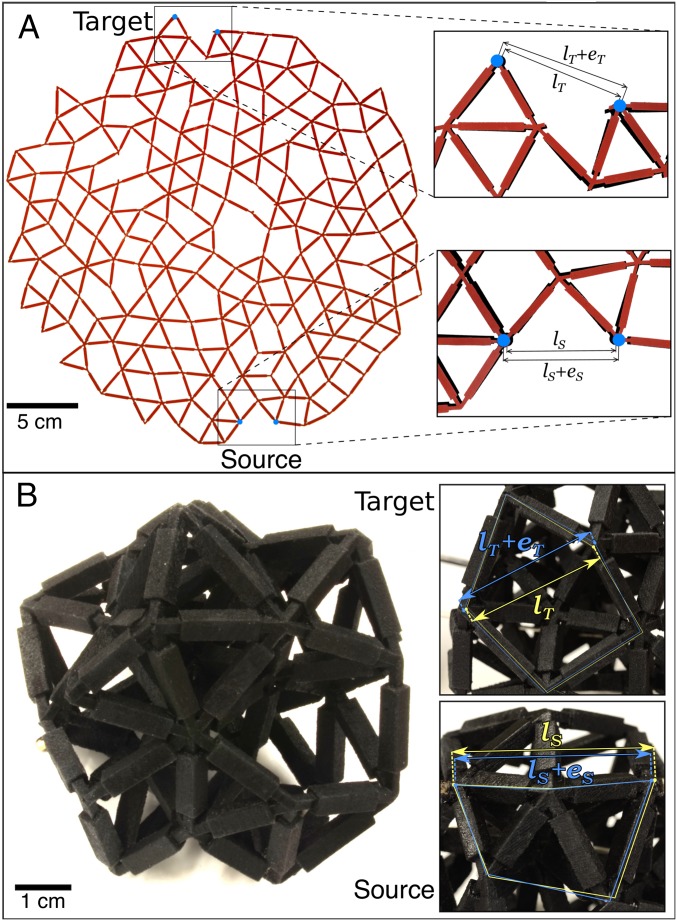
Fig. 4.
(A) Physical realization of the network in Fig. 1A. (Insets) Zoom-ins show the initial and final distance between the source nodes, and , respectively, and between the target nodes, and . The undeformed network is shown in black, and the deformed network is superimposed in red. (B) Photograph of a 3D network constructed by 3D printing with 33 nodes and 106 bonds at tuned to exhibit a negative response (). (Insets) In the zoom-ins, the yellow and blue arrows show the distance between the undeformed, (), and deformed, (), source (target) nodes, respectively.

