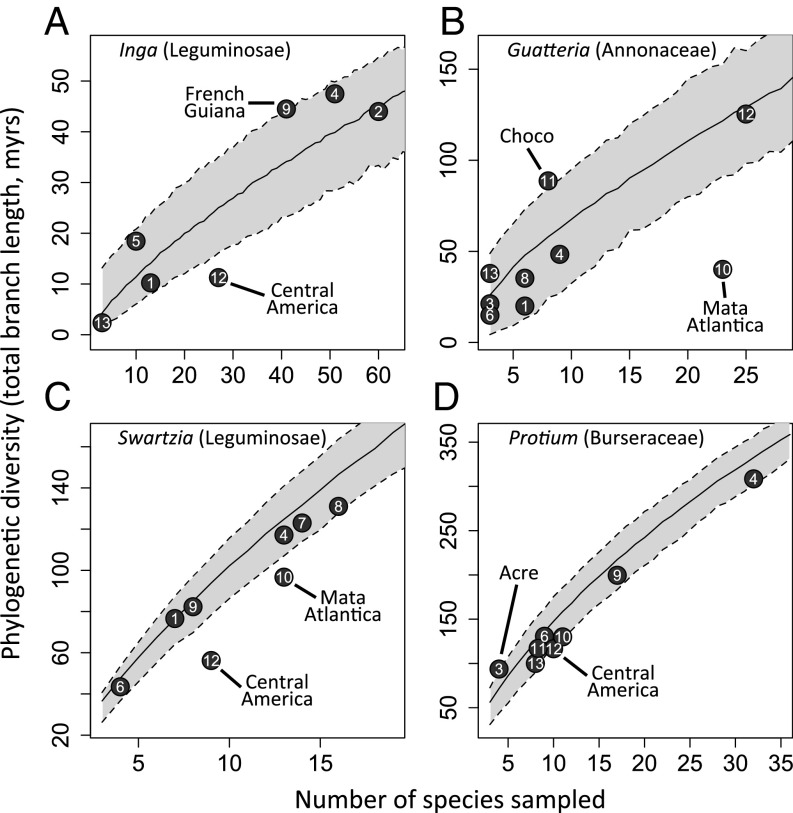
Fig. 3.
Relationship between number of taxa sampled and phylogenetic diversity in neotropical regions for four emblematic Amazonian tree genera. Phylogenetic diversity was evaluated as the sum of branch lengths in an ultrametric, temporally calibrated phylogeny including the taxa from a given region. Regions are numbered as in Fig. 1. The solid black line represents the mean null expectation for phylogenetic diversity given the number of taxa sampled, for 1,000 random draws of that number of taxa from the phylogenies. The shaded gray area denotes the 95% confidence intervals of the null expectation for the relationship. Regions that fall outside of the 95% confidence intervals are labeled.

