Fig. 3.
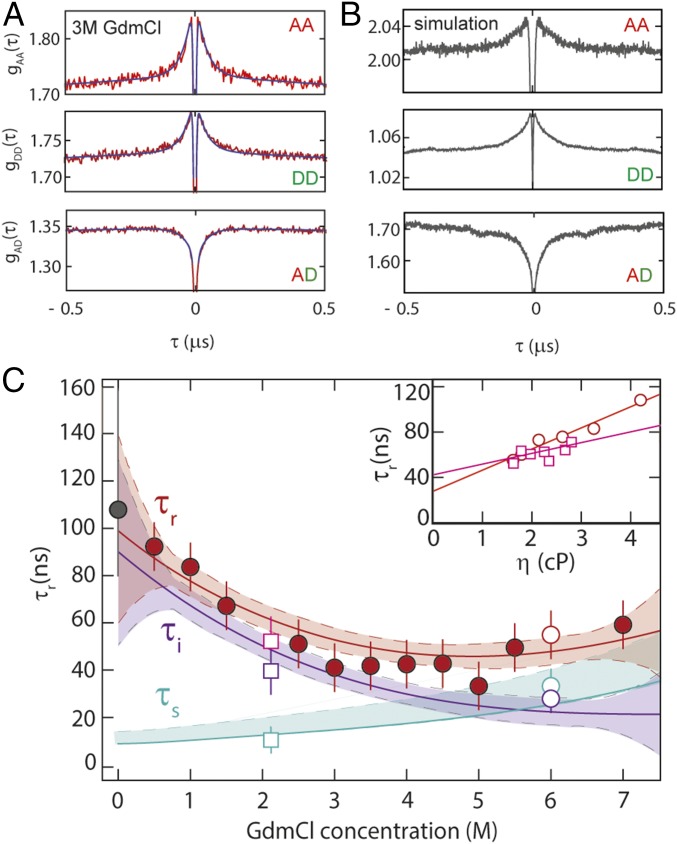
Probing unfolded-state dynamics by FRET-FCS. (A) Autocorrelation of acceptor fluorescence, gAA(τ); donor fluorescence, gDD(τ); and cross-correlation of acceptor and donor fluorescence, gAD(τ), at 3 M GdmCl; black lines show a global fit of the three correlations, with the reconfiguration time, τr, as a shared fit parameter. (B) FRET-FCS correlations gAA(τ), gDD(τ), and gAD(τ) based on the MD trajectory of unfolded protein L (31) (SI Appendix). (C) τr from the global fit of gAA(τ), gDD(τ), and gAD(τ) (red-filled circles); the internal friction contribution, τi, (purple line), is obtained by subtracting from the polynomial interpolation curve of τr (red line) the solvent component, τs (cyan line). The gray-filled circle at 0 M GdmCl represents the reconfiguration time of the chain from the MD simulation (SI Appendix). Error bars represent an average relative error of 15%, as estimated from the SD of multiple independent measurements. Confidence intervals (90%) of the fit are represented as shaded areas of the corresponding color. (Inset) τr at 2.2 M (empty squares) and 6.0 M GdmCl (empty circles) as a function of solution viscosity, η; linear extrapolation to zero viscosity (Eq. 1) allows τs (empty cyan circle and square in main panel) and τi (empty purple circle and square in main panel) to be estimated.

