Fig. 4.
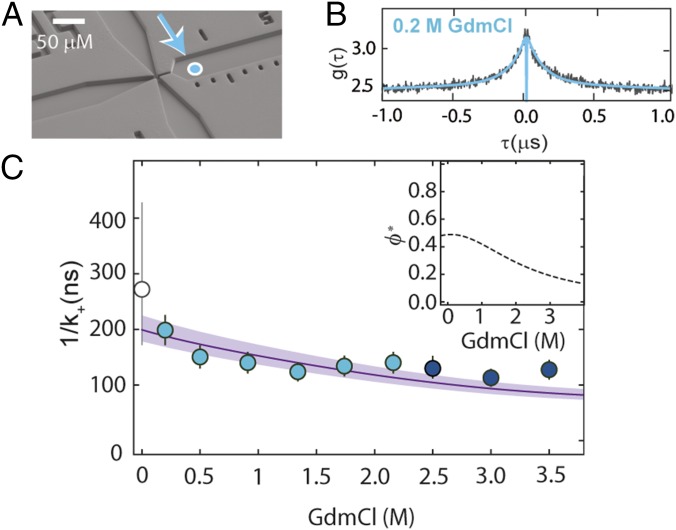
Probing unfolded-state dynamics by PET. (A) Electron micrograph of the microfluidic mixing device (51) used for transiently populating unfolded protein L at low denaturant concentrations. Fully denatured protein in 3 M GdmCl in the sample inlet (left channel) is mixed with buffer from the side inlets (top and bottom channels) to measure the dynamics of the fully unfolded protein in the right observation channel at low denaturant concentrations. The cyan-filled circle identifies the first position where complete mixing is observed, corresponding to a time after mixing of ∼4 ms. (B) PET-FCS measurement of unfolded protein L in 0.2 M GdmCl within the microfluidic device, with fit (blue line). (C) Contact formation time, obtained by correcting the observed rate, k+obs, for the GdmCl-dependent quenching efficiency, ϕ* (Inset). The line shows the fit with Eq. 2. Error bars represent an average relative error of 13%, as estimated from the SD of multiple measurements at a single GdmCl concentration. The corresponding value of 1/k+ based on the MD simulation of unfolded protein L (31) with a contact radius of 0.83 ± 0.10 nm is shown as an empty circle with an error bar corresponding to a variation in the contact radius of 0.10 nm.

