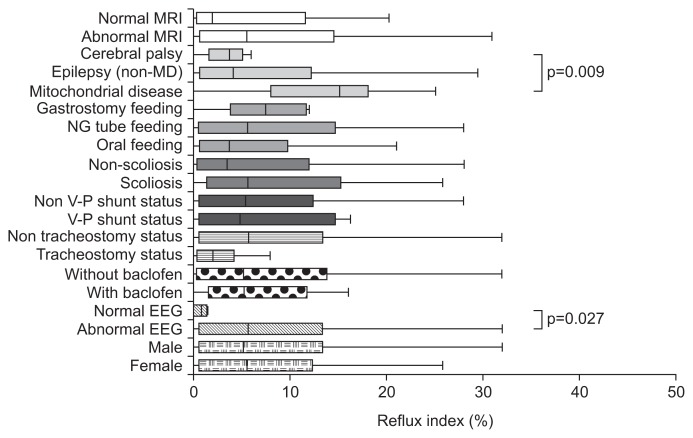
Fig. 1.
Box and whisker plot of reflux index showing the reflux index distribution according to clinical condition. The box represents the interquartile range, and the line in the box indicates the median value. Differences with a p-value of <0.05 are marked.
MRI, magnetic resonance imaging; MD, mitochondrial disease; NG, nasogastric; V-P, ventriculoperitoneal shunt; EEG, electroencephalography.

