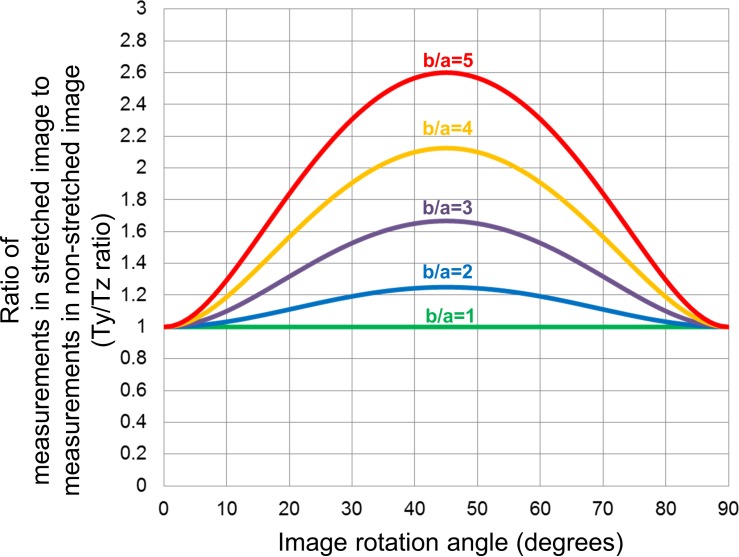
Figure 3.
Simulated relationship between measurement errors, stretching and image rotation in OCT images when thickness was measured perpendicular to the RPE. The graph was generated from Formula (5). The curves similar to a Gaussian distribution showed relationships between the Ty/Tz ratio and image rotation angle, where Ty and Tz were thickness measured perpendicular to RPE in the original stretched image and thickness measured perpendicular to the RPE in the anatomically correct image, respectively. Each colored line presents different severity of image stretching (b/a), where “a” is the axial resolution (μm/pixel) and “b” is the transverse resolution (μm/pixel). Ty/Tz ratio was larger in tilted images with greater angles and more severe stretching (higher b/a) at the rotation angle ranging from 0 to 45°. Note that Ty/Tz ratio is 1.00 at an angle of 0°, regardless of the severity of stretching, and is also 1.00 at any angle in an anatomically correct image (b/a = 1).

