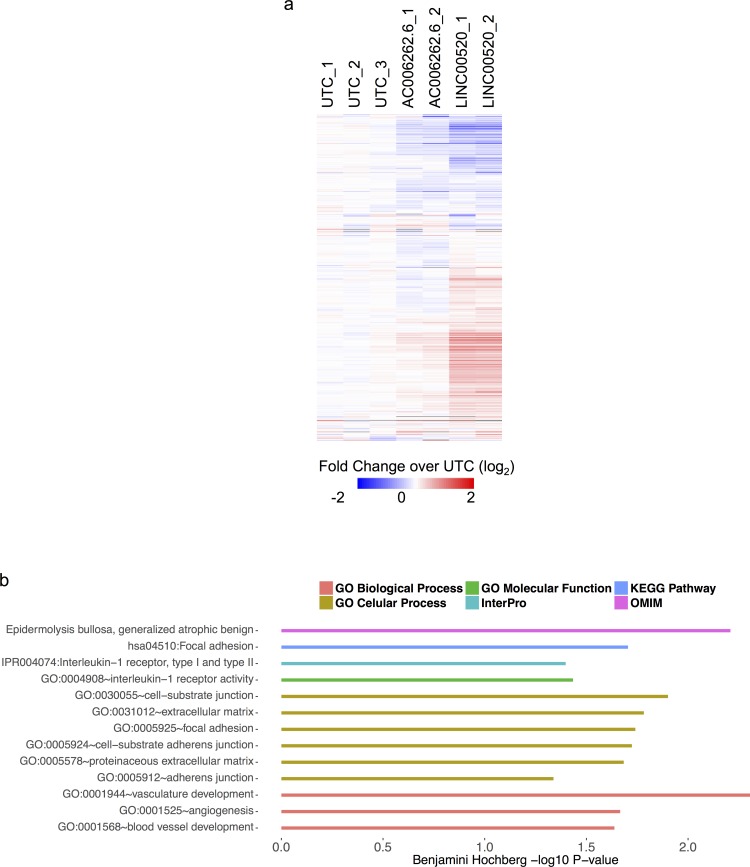
Figure 6. Heat map showing expression profile of MCF10A cells expressing LINC00520.
a. All genes (1693 genes) depicted in the heat map are upregulated in MCF10A-Src transformed cells. Abbreviations: UTC - Untransformed MCF10A cells; AC006262.6 is a lncRNAs that is not involved in transformation (negative control). Scale bar shows log2 row median centered expression values. b. GO analysis of a subset of genes that are upregulated upon ectopic expression of LINC00520 in MCF10A cells (grey line in heat map denotes top 291 genes used for analysis).

