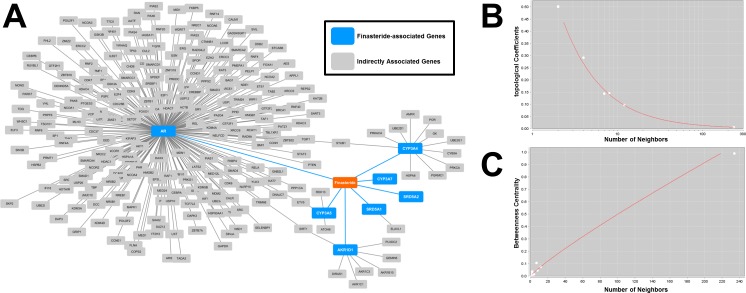
Figure 1. Visualization and analysis of drug-gene network.
A. The finasteride-associated genes and indirectly associated genes were integrated into a network. A node denoted a drug (i.e., finasteride) or a gene. An edge represented an interaction between two nodes. B. The topological coefficients followed the power law distributions, with an R2 = 0.99. C. The betweenness centrality followed the power law distributions, with an R2 = 0.84.

