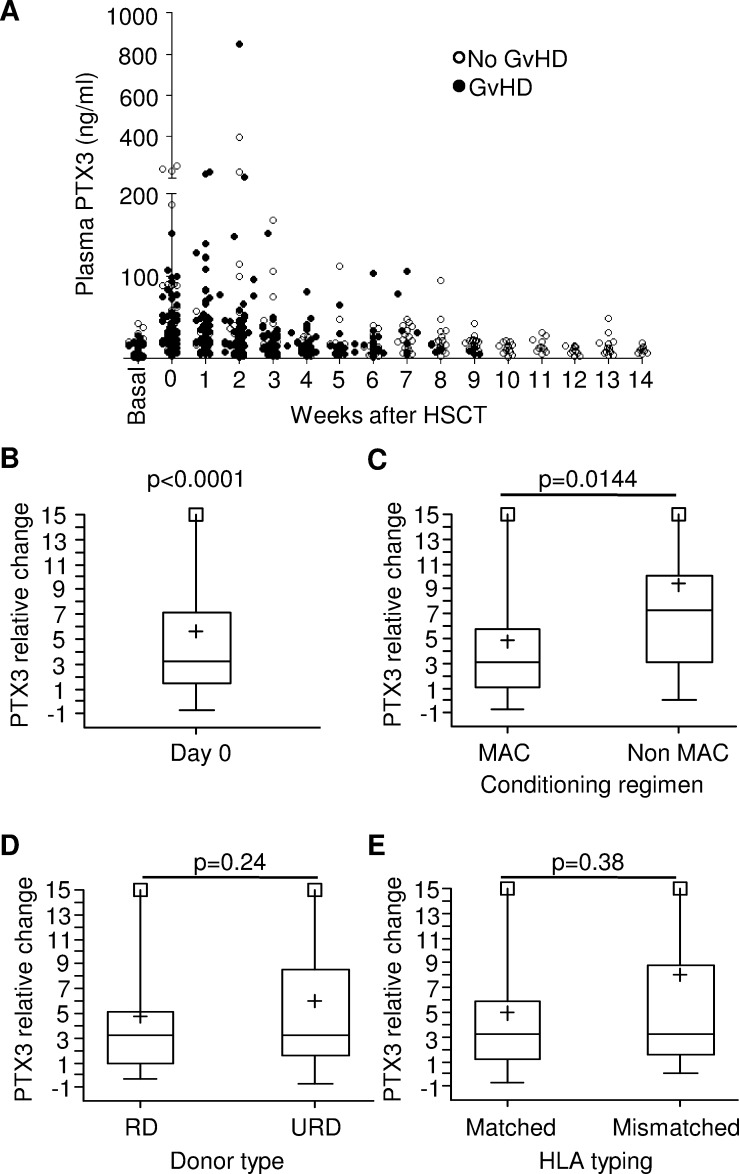
Figure 2. Monitoring and analysis of PTX3 levels in the plasma of HSCT pediatric patients.
A. Available PTX3 plasma levels measured on 115 patients before the beginning of conditioning regimen (basal), on day 0 (HSCT) and weekly until day +100 for patients not experiencing GvHD, or until disease occurrence for GvHD patients. B. Relative change (RC) of PTX3 concentration over baseline at day 0 in 96 patients where both measurements could be performed. RC was calculated as follows: day 0 RC = (day 0 PTX3- basal PTX3/basal PTX3). The p-value indicates that RC at HSCT is significantly different from zero. C. PTX3 RC at day 0 measured according to the intensity of the conditioning regimen, D. the type of donor (RD = related donor, URD = unrelated donor), and E. the HLA-matching in the donor/recipient pair (HLA-matched = matching ≥9/10 in the case of bone marrow or peripheral blood; = 6/6 in the case of cord blood). Each box-plot shows the median, the first and third quintiles and extends from the lowest to the highest value; extreme outliers are not shown, but were included in the calculations.

