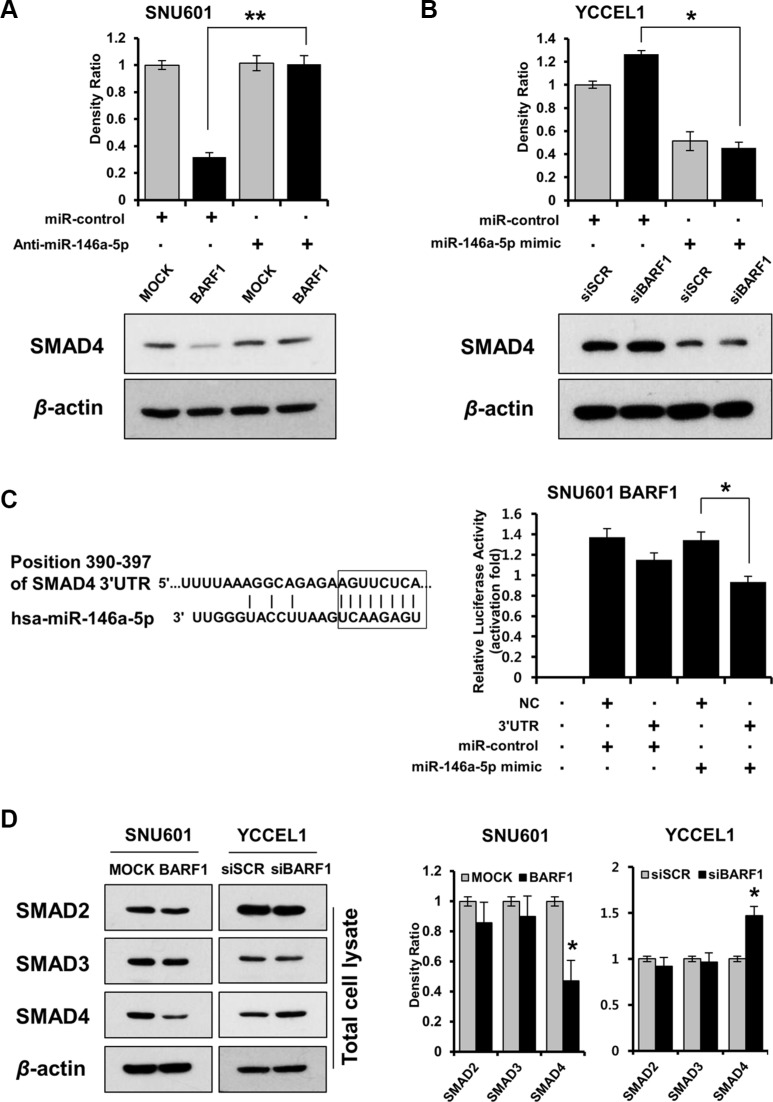
Figure 3. BARF1 downregulated SMAD4 in a miR-146a-5p-dependent manner, and SMAD4 was a direct target of miR-146a-5p.
(A) SMAD4 protein expression in SNU601 BARF1 cells was measured via western blotting after transfection with a miR-146a-5p inhibitor (anti-miR-146a) or a scrambled miRNA control (miR-control). SMAD4 protein level was downregulated in SNU601 BARF1 cells, and was restored by miR-146a-5p inhibition (*P < 0.05). (B) YCCEL1 cells (naturally EBV-infected stomach cancer) were transfected with 20 nM siRNAs (BARF1-specific or scrambled) and 50 nM miRNAs (miR-146a-5p mimic or miR-control). SMAD4 was upregulated in YCCEL1/siBARF1 cells and downregulated by the miR-146a-5p mimic (*P < 0.05). (C) The 8-mer sequence homology between miR-146a-5p and the 3′UTR of SMAD4 mRNA is shown. The mRNA transcript sequences were extracted from the website (http://www.ensembl.org). The luciferase assay revealed reduced reporter activity after co-transfection of SMAD4 3′UTR and miR-146a-5p in SNU601 BARF1 cells, compared with co-transfection of a negative control (NC, empty vector) and miR-146a-5p (*P < 0.05). All experiments were performed in triplicate. (D) BARF1 downregulated SMAD4 in total cell lysates, but had no effect on SMAD2 or SMAD3 expression. The bar graph shows the ratio of SMAD normalized to β-actin as determined by optical density measurement (*P < 0.05). All experiments were performed in triplicate.

