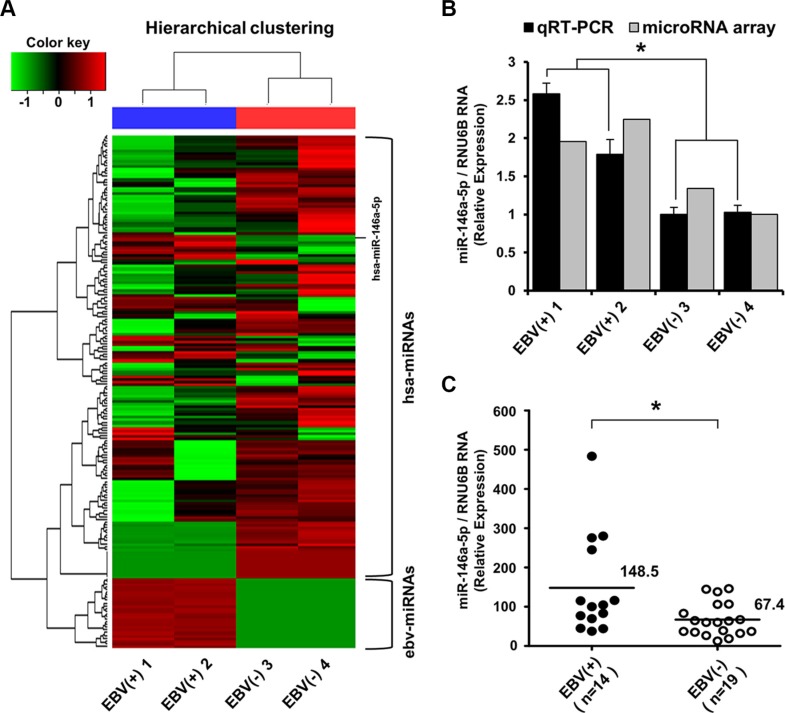
Figure 5. miRNA microarray expression profile and validation of miR-146a-5p level in surgically resected stomach cancer tissues.
(A) Heat map and hierarchical clustering of miRNA expression showed a clear contrast between EBV-positive and EBV-negative cancer groups, with 31 miRNAs being upregulated including miR-146a-5p. Tissue samples are denoted as EBV(+) 1 and EBV(+) 2 for EBV-infected stomach cancer tissues and EBV(−) 3 and EBV(−) 4 for EBV-negative stomach cancer cases. The upper horizontal section represents human cellular miRNAs (hsa-miRNAs), and the lower horizontal section indicates EBV miRNAs (ebv-miRNAs). The red color indicates the expression of miRNAs in the sample, and green indicates absent or downregulated miRNAs. (B) TaqMan quantitative real-time RT-PCR was used to validate miRNA microarray data. miR-146a-5p levels were higher in EBV-positive stomach cancer tissues than in EBV-negative stomach cancer tissues (*P < 0.05). (C) TaqMan quantitative real-time RT-PCR for miR-146a-5p was performed for an additional 14 cases of EBV-positive stomach cancer tissues and the other additional 19 EBV-negative stomach cancer tissues. The miR-146a-5p level in the EBV-positive stomach cancer group was higher than that in the EBV-negative stomach cancer group (*P < 0.05). RNU6B was used to normalize miR-146a-5p expression.

