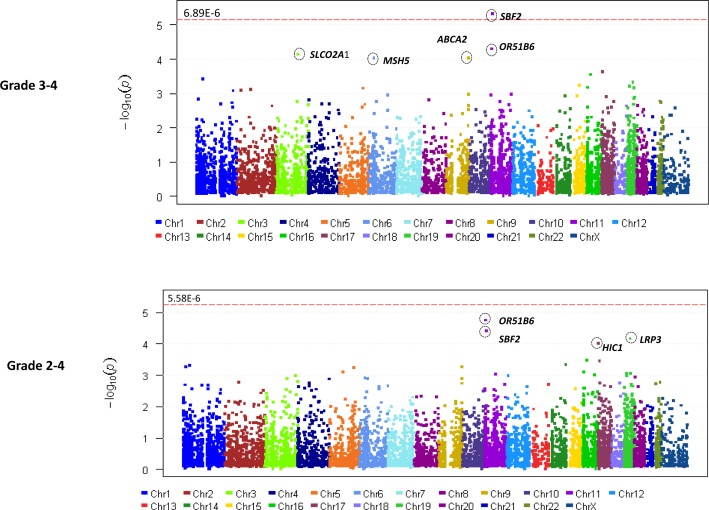
Figure 2.
Manhattan plot (A) for Grade 3-4 TIPN from AA patients in ECOG-5103. X-axis indicates the chromosomal position of each gene analyzed; Y-axis denotes magnitude of the evidence for association, shown as −log10(p-value); Each dot represents an evaluable gene. (B) Grade 2-4 TIPN from AA patients in ECOG-5103. X-axis indicates the chromosomal position of each gene analyzed; Y-axis denotes magnitude of the evidence for association, shown as −log10(p-value); Each dot represents an evaluable gene. The dashed line indicates the genome-wide significance threshold.

