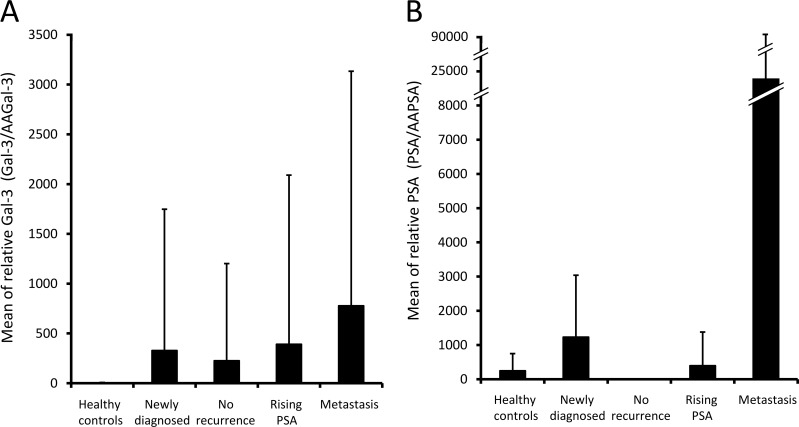
Figure 1. Relative Gal-3 and relative PSA levels in patients at different clinical states of prostate cancer.
Gal-3 and PSA concentrations were divided by their respective autoantibody levels, and the values were referred to as relative Gal-3 and relative PSA. Bars show the mean values of A. relative Gal-3 and B. relative PSA Whisker heights indicate standard deviations.

