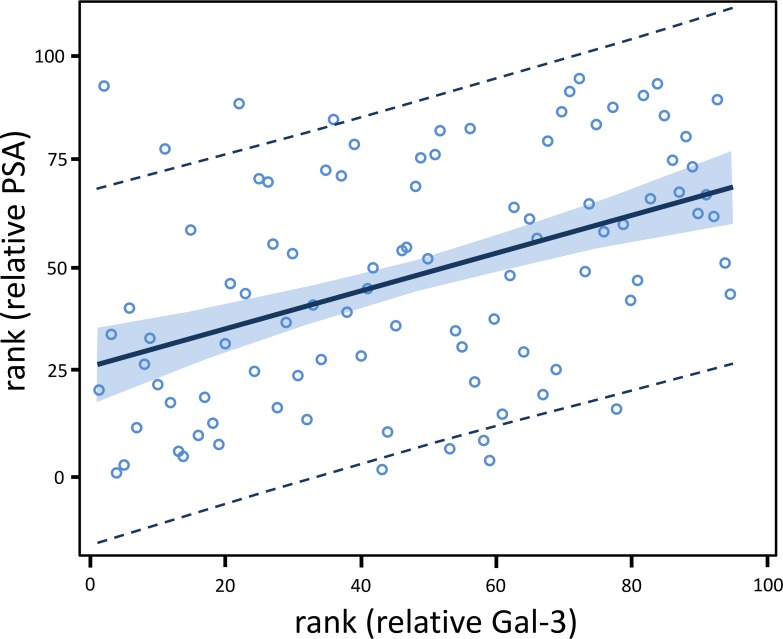
Figure 2. Relative Gal-3 level is positively associated with relative PSA level among all 95 men.
Gal-3 and PSA concentrations were each divided by their respective autoantibody level, and the values were referred to as relative Gal-3 and relative PSA. The fitted regression model was: rank (relative PSA) = 26.517 + 0.448*rank (relative Gal-3) (P < 0.0001). The lines at the outer edges of the blue band define the 90% confidence limits (CLs) for predicting the mean of rank (relative PSA) for a given value of rank (relative Gal-3). The dashed lines define the 90% confidence limits (CLs) for predicting an individual value of rank (relative PSA) for a given value of rank (relative Gal-3).

