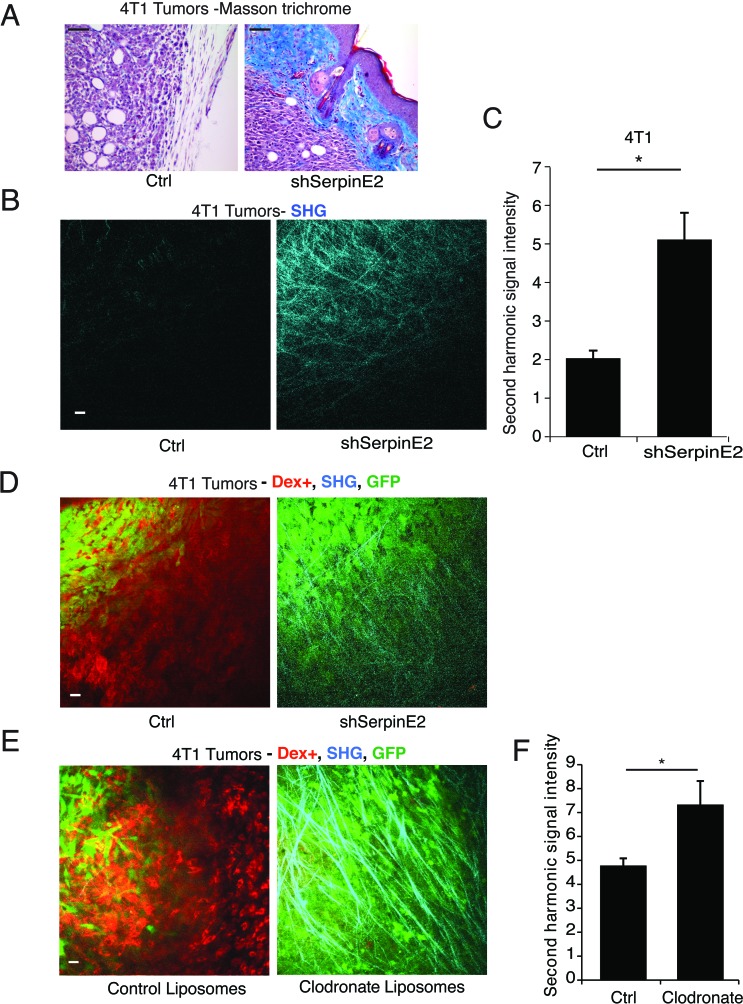
Figure 1. SerpinE2 controls tumor matrix density and matrix-remodeling.
(A) Masson trichrome staining performed on 4T1 Ctrl and shSerpine2 tumors. Representative images show increased collagen encapsulation (blue) of SerpinE2 KD tumors. Scale bar100μm. (B-C) Intravital imaging using (IVI-MP) of 4T1 Ctrl and shSerpine2 tumors. (B) Representative images show collagen I fibers detected by the SHG signal (cyan) at the surface of 4T1 tumors; scale bar25μm. (C) Average SHG signal intensity was determined per 100μm z-stack; data are acquired from 19-30 separate z-stacks from 3 mice per cell line. *P < 0.00036. D. IVI-MP performed on mice bearing GFP-labeled 4T1 control and shSerpinE2 tumors. Representative images show GFP-labeled tumor cells (green), phagocytic dextran positive cells (red); SHG imaging identified collagen I fibers (cyan). Scale bars25μm. (E-F) (E) GFP-labeled 4T1 tumor-bearing mice were treated with control liposomes or clodronate-containing liposomes until IVI-MP was performed. Representative images are shown as in (D). (F) Quantification of SHG (cyan) signal intensity in 100 μm Z-stacks of tumors in treated animals. Data are mean ± SEM of measurements from 40-61 Z-stacks from at least 3 different tumors for each treatment group. *P < 0.016. All data are mean ± SEM.

