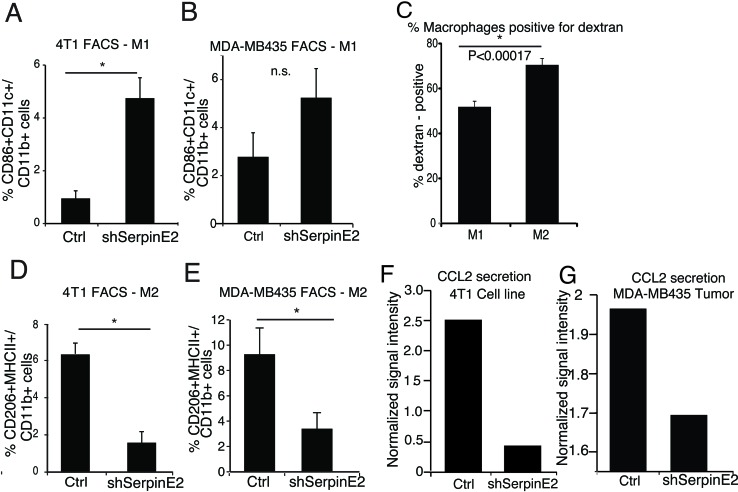
Figure 2. SerpinE2 controls tumor-promoting macrophages and CCL2 levels.
(A-B) 4T1 (A) and MDA-MB435 (B) control and shSerpinE2 tumors were harvested and FACS analyses were performed for % of CD86+CD11c+ M1 macrophages in the CD11b+ cell population. (A) n = 4 mice per group, * P < 0.012; (B) n = 3-5 mice per group, P < 0.12 (n.s.). (C) FACS analyses were performed for the percentage of dextran-positive CD11b+ CD86+CD11c+ M1 and CD206+MHCII+ M2 macrophages from 4T1 control tumor-bearing mice, i.v. injected with Texas Red Dextran 1 hour before dissection. (n = 7 mice per group), *P < 0.00017. (D-E) 4T1 (D) and MDA-MB435 (E) control and shSerpinE2 tumors were harvested and FACS analyses were performed for % of CD206+MHCII+ M2 macrophages in the CD11b+ cell population. (D) n = 4 mice per group, * P < 0.0022; (E) (n = 3-5 mice per group). * P < 0.024. All Data are the means ± SEM. (F) Cytokine arrays from 4T1 control and shSerpine2 tumor cells in culture. Bars show normalized signal intensity for CCL2. CM from N = 3 plates was used for each cell line. G. Cytokine arrays from primary MDA-MB435 control and shSerpine2 tumors. Bars show the normalized signal intensity for CCL2. CM from N = 3 tumors was used.

