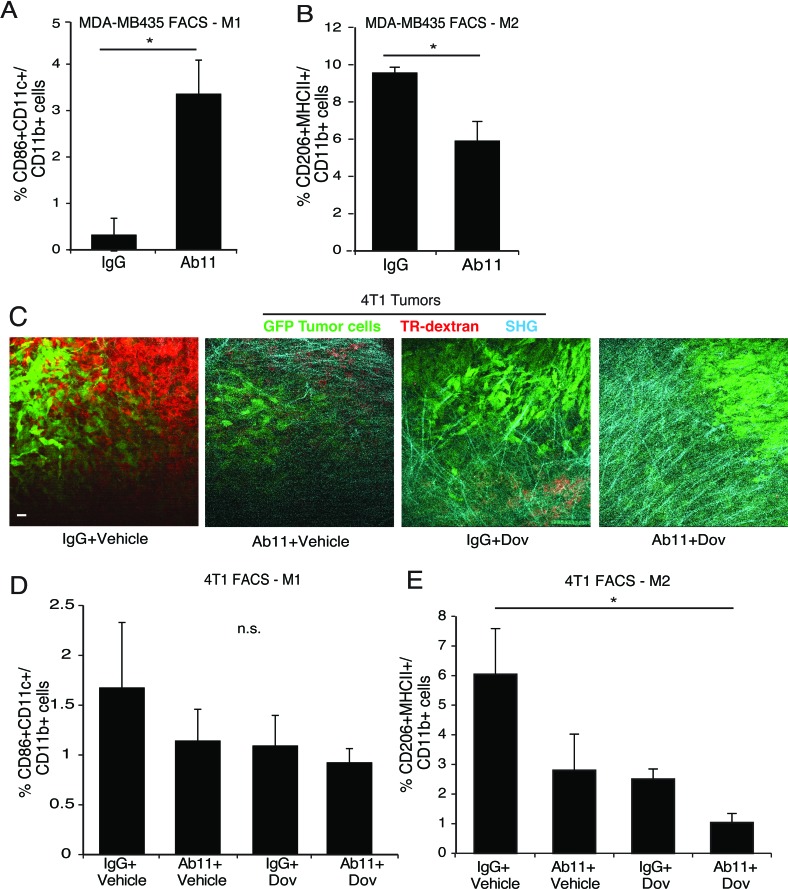
Figure 6. Ab11 treatment leads to a decrease in M2 macrophages and increase in tumor matrix density.
(A-B) FACS analysis performed on MDA-MB435 tumors harvested from mice treated as indicated, for % of CD86+CD11c+ M1 macrophages (A) and % of CD206+MHCII+ M2 macrophages (B) in the CD11b+ cell population. (n = 3-5 mice per group). *P < 0.007, * P < 0.029, respectively. (C) Representative images from IVI-MP of 4T1 tumor-bearing mice, treated as indicated, show GFP-labeled tumor cells (green), phagocytic dextran positive cells (red); SHG imaging identified collagen I fibers (cyan). Scale bar25μm. (D-E) FACS analysis performed on 4T1 tumors from mice treated as indicated, for % of CD86+CD11c+ M1 macrophages (D) and CD206+MHCII+ M2 macrophages (E) in the CD11b+ cell population. (n = 3-5 mice per group). * P < 0.024. Data are shown as the means ± SEM.

