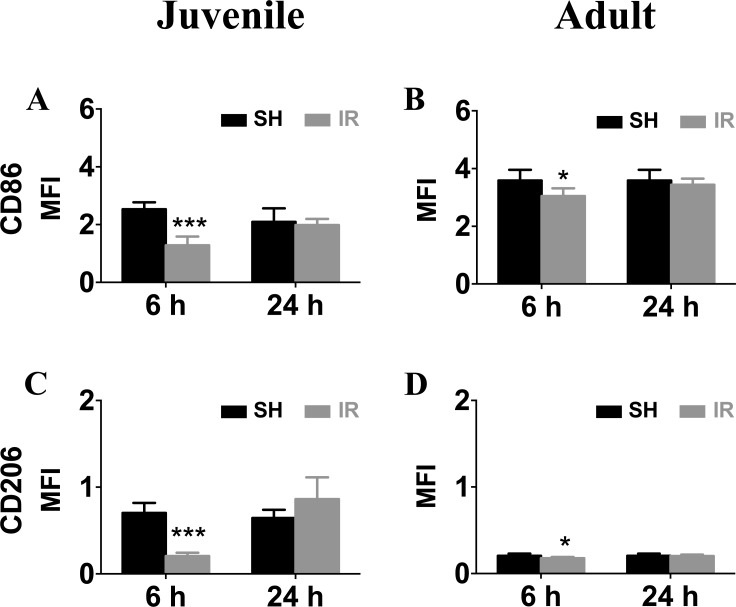
Figure 10. Irradiation downregulated microglia surface expression of CD86 and CD206.
Representative histograms of CD86 and CD206 surface levels on microglia isolated from sham control (SH) or irradiated (IR) hippocampi from juvenile (left panel) and adult brains (right panel). Surface mean fluorescence intensity (MFI) for CD86 (A) and CD206 (B) Data are shown as mean ± S.D., n = 3 for the sham groups, 5-6 for the irradiated groups. Asterisks indicate comparison between irradiated groups and the corresponding sham controls. *P < 0.05, ***P < 0.001.

