
Figure 3. Phenotype of CART cells exposed to different cytokines.
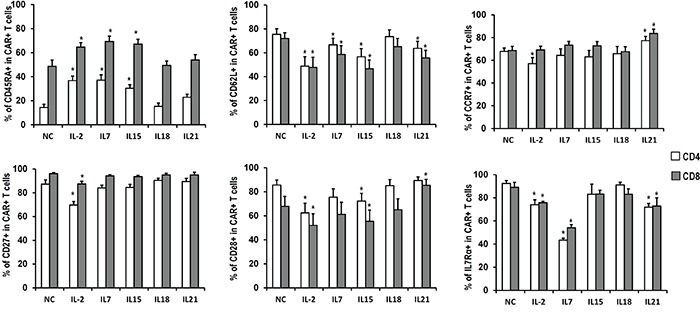
Quantitation of CD45RA, CD62L, CCR7, CD27, CD28 and IL7Rα expression in CART cells expanded in the presence of indicated cytokines. Histograms represent mean values ± SEM from 6 independent donors. *P <0.05versus no cytokine (NC) group.