
Figure 6. Antitumor activity of various CART cells with previous cytokine exposure.
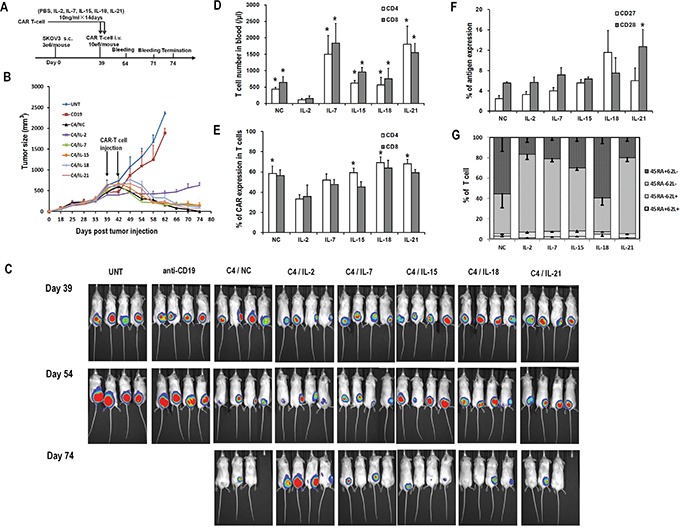
A. In vivo experiment scheme. B. Tumor growth curves of mice treated with C4-27z CART cells, anti-CD19-27z CART cells and untransduced T cells. Data is presented as mean value ± SEM. Arrows indicate the time of T cell infusion. C. Bioluminescence images show fLuc+ SKOV3 tumors in NSG mice immediately before (day 38), two weeks (day 53) and five weeks (day 74) after first intravenous injection of CART cells. D. Quantitation of circulating human CD4+ and CD8+ T cell counts in mice peripheral blood 15 days after the first dose of CART cell infusion. *P<0.05 versus IL-2 group. E. Quantitation of CAR expression on circulating human CD4+ and CD8+ T cells in mice blood. *P<0.05 versus IL-2 group. F. Quantitation of CD27 and CD28 expression on circulating human T cells in mice blood. G. Distribution of T-cell subsets of circulating human T cells in mice blood based on CD45RA and CD62L staining.